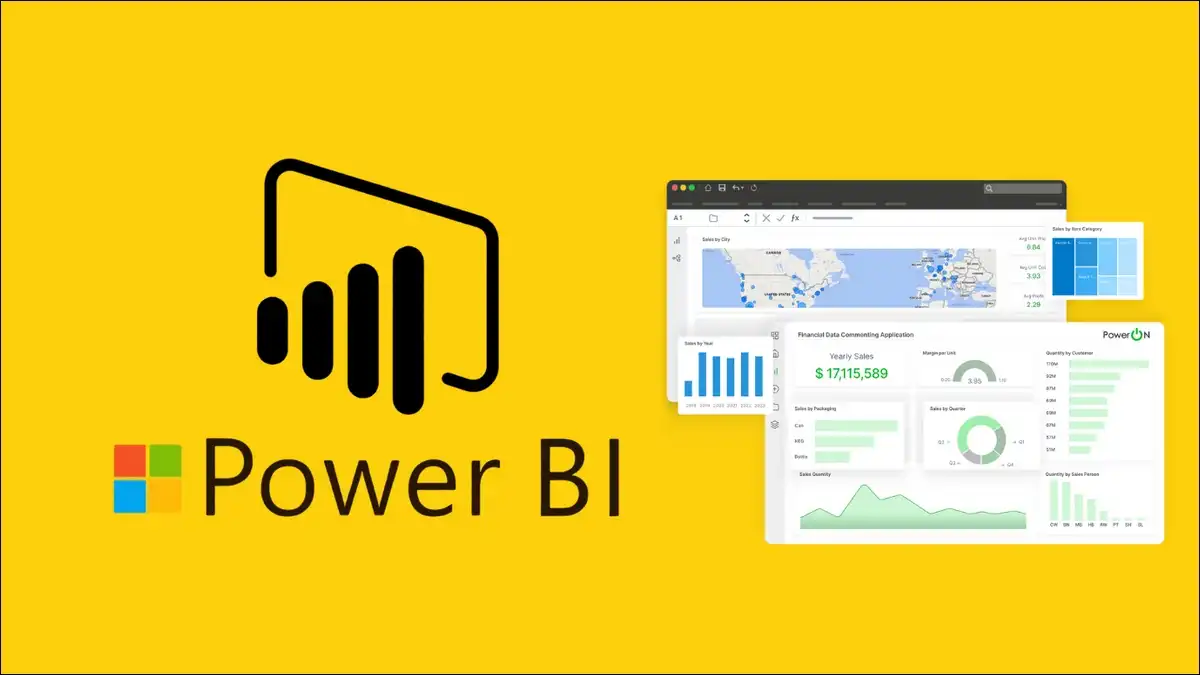
Power BI In 2026: Latest News And How to Make Most of It
Power BI 2026 updates explained – new features like Translytical Task Flows, modern visuals, Copilot improvements, and practical tips to get the most from it.
If you work with data, you probably already use Power BI or have heard about it atleast. Microsoft’s popular business intelligence tool helps users connect to data, clean it, build reports and dashboards, and share insights with your team.
In 2026, Power BI keeps on getting better with monthly updates, stronger AI features, and closer ties to Microsoft Fabric. In this post, we’ll walk through the latest news about Power BI, the most useful new features, and practical ways you can use them.
Whether you are just starting or already building reports every day, this guide gives you clear, actionable information.
What Is Power BI Today?
Basically, Power BI lets you turn raw data into clear visuals and stories. You connect to sources like Excel, databases, web services, or cloud platforms. Then you clean and shape the data, create calculations with DAX, and design interactive reports.
And in this end, you publish them to the Power BI Service (powerbi.com) so others can view and explore them.
Now, Power BI feels more integrated than ever. It works closely with Microsoft Fabric for larger-scale data work and uses Copilot AI to help you write formulas or generate narratives.
Many organizations choose it because it balances ease for business users with real depth for analysts.
Major Updates in Early 2026
Microsoft releases Power BI updates every month.
The recent one i.e March 2026 update (version 2.152.882.0) stands out as one of the strongest so far. It came out around the same time as FabCon and brought several practical improvements.
Here are the key highlights:
- Translytical Task Flows (Now Generally Available): You can now take action directly inside reports. For example, users can update records or approve items without leaving Power BI. This write-back feature makes reports more interactive and useful for daily operations.
- Input Slicer (Generally Available): Previously called Text Slicer, this now lets people type or paste values to filter reports dynamically. It feels natural and speeds up exploration.
- Modern Visual Defaults and Theme Improvements: New reports use a cleaner, Fluent 2-inspired design by default. You get a gray canvas background, smoother lines, better buttons, and improved legends. Reports look more professional with less manual work.
- Copilot Enhancements: Copilot keeps getting smarter. You can now access it from the home screen, get auto-refreshing AI Narratives, and receive better DAX suggestions. The Copilot pane has a refreshed look that matches other Microsoft tools.
- Modeling Improvements: Custom totals in tables and matrices (in preview), new DAX functions, and TMDL view in web modeling give you more control. Composite models now mix Direct Lake and Import modes more flexibly.
- Visual Upgrades: Line charts now support series label leader lines. Azure Maps has fully replaced Bing Maps. Tooltips look more modern, and column sizing can adjust based on content.
Other recent months brought flexible report interactions (February) and stronger semantic model editing (January).
Microsoft is also moving new reports to the enhanced PBIR format by default for better performance and version control.
These changes show a clear direction: make everyday authoring faster, visuals more polished, and analytics more actionable with AI help.

How to Get Started with Power BI in 2026
Like from the start, getting started with Power BI remains simple, even with the new features.
- Download Power BI Desktop for free from the Microsoft website here. This is your main tool for building reports.
- Connect to your data using “Get Data.” You can pull from Excel, SQL databases, Azure services, or many other sources. Power Query helps you clean and transform everything.
- Build your data model by creating relationships between tables. Use DAX for calculations — or let Copilot suggest formulas to save time.
- Create visuals by dragging fields onto the canvas. Add charts, tables, slicers, and maps. Apply one of the new modern themes for a clean look right away.
- Publish your report to the Power BI Service. There you can create dashboards, set up scheduled refreshes, and share with colleagues.
- Explore and collaborate. Use apps, workspaces, or embed reports in Teams and SharePoint. Row-level security helps control who sees what.
Quick tip for beginners: Start small. Build one simple report with real data from your job. Experiment with Copilot for quick insights. Once you feel comfortable, try the new Translytical task flows or Input Slicer to make reports more interactive.
Microsoft Learn and the official Power BI Blog remain excellent free resources. Many community videos also cover the 2026 updates in detail.
Adoption, Market Position, and Real-World Insights
Power BI holds a strong position in the business intelligence market. Estimates suggest it commands around 30–35% market share in 2026, with tens of millions of monthly active users and over 100,000 organizations as customers.
Its popularity comes from tight integration with Microsoft tools most companies already use — Excel, Teams, Azure, and now Fabric. Many teams start with self-service analytics and gradually move toward governed enterprise solutions.
However, adoption inside organizations is not always smooth. Surveys show that while many companies have Power BI licenses, full enterprise-wide usage often stays below 50%. Common challenges include governance of sprawling report collections, the learning curve for DAX, and scaling large datasets.
In 2026, successful implementations focus on a few high-impact dashboards rather than hundreds of scattered reports. Strong data governance, proper training, and clear business use cases make the biggest difference.
One useful insight: AI features like Copilot help reduce the manual work that used to slow teams down. Features such as auto-refreshing narratives and DAX suggestions let business users get insights faster without waiting for specialists.
Key Considerations and Best Practices for 2026
Power BI works best when you combine it with good habits:
- Pay attention to deprecations. Microsoft retires older features from time to time (for example, certain legacy connectors and the old Q&A experience). Test reports in a development workspace before major updates.
- Use modern defaults and themes. They save time and make reports look consistent across your organization.
- Leverage Fabric integration for larger projects. Direct Lake mode and composite models help handle big data more efficiently.
- Focus on governance early. Define workspaces, apps, and security rules so reports stay organized as your team grows.
- Combine tools thoughtfully. Power BI excels at visualization and self-service, but some teams pair it with other platforms when they need different strengths.
Many organizations see the best results when they treat Power BI as part of a broader data strategy rather than a standalone tool.
End Note
Power BI in 2026 is more capable, more AI-assisted, and more deeply connected to the Microsoft ecosystem than before. Monthly updates bring real improvements in usability, visuals, and intelligence. Translytical task flows, modern defaults, and smarter Copilot features stand out as particularly useful for everyday work.
Whether you are building your first report or managing a large analytics environment, staying current with the official Power BI Blog and release notes helps you get the most value. Start small, experiment with the new capabilities, and focus on reports that actually drive decisions.
We hope this guide gives you a clear picture of where Power BI stands today and how you can use it effectively.
Further, head to the Power BI Blog for the latest feature summaries and try the new updates in your next report. Small, consistent improvements in how you work with data can make a big difference over time.