125 Marketing Automation Statistics in 2026: Latest Data Points
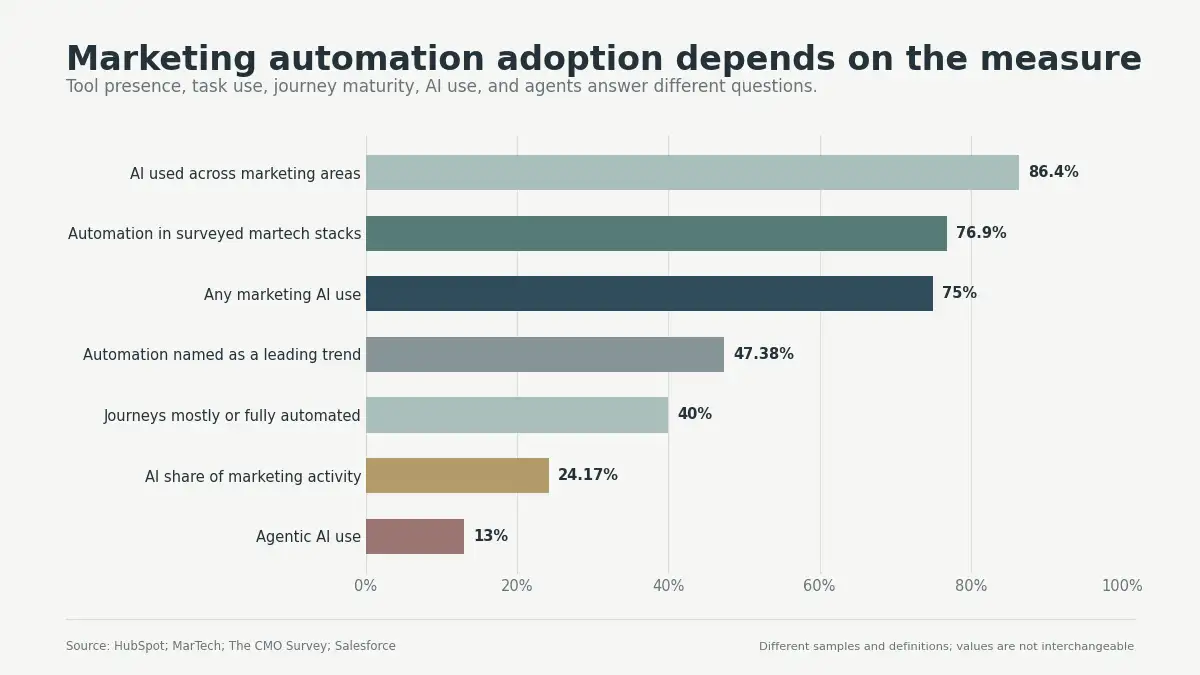
Marketing automation is common, but each adoption measure describes something different. HubSpot finds 47.38% naming automation as a leading trend. MarTech reports 76.9% stack presence, though its sample includes 169 respondents. HubSpot separately finds 40% mostly or fully automated journeys.
This article presents 125 current marketing automation statistics that are manually verified by me. Every figure keeps its period, sample, geography, and evidence type. Verification ended on August 11, 2026. Surveys, platform data, forecasts, and internal tests remain labeled.
No single marketing automation adoption rate exists
There’s no universal marketing automation adoption percentage found during 2026. Current sources measure trends, task use, journey maturity, or stack presence. AI adoption and agent use measure different stages entirely.
Tool ownership differs from workflow maturity
Tool ownership confirms platform presence, while workflow adoption shows actual task use. Journey maturity measures coordination across several customer touchpoints.
None of these measures proves incremental business value.
| Measure | Current figure | Correct interpretation |
|---|---|---|
| Automation named as a leading trend | 47.38% | Strategy prominence among HubSpot’s global marketer sample |
| Automation within surveyed martech stacks | 76.9% | Category presence among 169 MarTech community respondents |
| Mostly or fully automated journeys | 40% | Journey maturity among HubSpot marketing teams |
| AI used within several marketing areas | 86.4% | Broad AI use among HubSpot’s global respondents |
| AI share of marketing activities | 24.17% | Mean activity share among US marketing leaders |
| Any marketing AI use | 75% | Salesforce respondents using at least one AI form |
| Current agentic AI use | 13% | Salesforce marketers using autonomous agents |
Verdict: cite the measure matching your exact business question. Never rewrite 76.9% as all-company adoption. That result covers a small martech community sample. Journey automation remains a stricter operational measure.
HubSpot shows broad task use but moderate journey automation
HubSpot surveyed more than 1,500 global B2B and B2C marketers. Its measures include strategy, tasks, AI frequency, and self-assessed skills. Statistics 1 through 11 retain those separate definitions.
They should not become one combined adoption estimate.
| # | Verified statistic | Key value | Period and denominator | Evidence type |
|---|---|---|---|---|
| 1 | Automation ranked as a top 2026 marketing trend for 47.38% of surveyed marketers. | 47.38% | 2026; 1,500+ global B2B and B2C marketers | Survey estimate |
| 2 | Marketers using automation for administrative tasks reached 93%. | 93% | 2026; HubSpot marketer survey | Survey estimate |
| 3 | Marketers using automation for data analysis and reporting reached about 92%. | ~92% | 2026; HubSpot marketer survey | Survey estimate |
| 4 | Marketing teams describing customer journeys as mostly or fully automated reached 40%. | 40% | 2026; HubSpot marketer survey | Survey estimate |
| 5 | Marketing teams using AI in at least a few areas reached 86.4%. | 86.4% | 2026; 1,500+ global marketers | Survey estimate |
| 6 | Marketing teams with no AI use and no adoption plans were only 1.7%. | 1.7% | 2026; 1,500+ global marketers | Survey estimate |
| 7 | AI content creation was extensive for 42.5% and occasional for 38% of marketers. | 42.5% extensive; 38% occasional | 2026; 1,500+ global marketers | Survey estimate |
| 8 | AI advertising automation was extensive for 34.1% and occasional for 36.5%. | 34.1% extensive; 36.5% occasional | 2026; 1,500+ global marketers | Survey estimate |
| 9 | AI administrative automation was extensive for 35.6% and occasional for 40.5%. | 35.6% extensive; 40.5% occasional | 2026; 1,500+ global marketers | Survey estimate |
| 10 | Marketers understanding AI use rose from 47% to 68.2%. | 47% to 68.2% | 2025 to 2026; HubSpot marketer survey | Survey trend |
| 11 | Marketers knowing how to measure AI impact rose from 48% to 67.5%. | 48% to 67.5% | 2025 to 2026; HubSpot marketer survey | Survey trend |
Sources for statistics 1 through 11: HubSpot State of Marketing 2026 supports statistics 1 and 5 through 11. HubSpot Marketing Statistics supports statistics 2 and 3, while HubSpot journey research supports statistic 4.
Administrative and reporting automation reaches most marketers, though journey automation remains moderate. Only 40% report mostly or fully automated journeys. This gap separates isolated tasks from connected orchestration. It also shows why platform ownership overstates operating maturity.
Salesforce shows broad AI use but early agent adoption
Salesforce surveyed 4,450 marketing professionals across 26 countries. Fieldwork ran from October 8 through November 17, 2025. Statistics 12 through 20 cover AI, agents, search, and conversations.
Most findings represent marketer reports rather than observed customer behavior.
| # | Verified statistic | Key value | Period and denominator | Evidence type |
|---|---|---|---|---|
| 12 | Marketing organizations using at least one form of AI reached 75%. | 75% | 2026 report; 4,450 marketing professionals, 26 countries | Survey estimate |
| 13 | Marketers currently using agentic AI accounted for 13%. | 13% | 2026 report; 4,450 global marketing professionals | Survey estimate |
| 14 | High-performing marketers were nearly twice as likely to use AI agents. | Nearly 2x | 2026 report; Salesforce performance-tier comparison | Survey association |
| 15 | Full AI integration remained unfinished for 61% of marketers. | 61% | 2026 report; Marketers using or implementing AI | Survey estimate |
| 16 | Marketers reshaping SEO because of AI reached 85%. | 85% | 2026 report; 4,450 global marketing professionals | Survey estimate |
| 17 | Marketers optimizing for AI-generated search responses reached 88%. | 88% | 2026 report; 4,450 global marketing professionals | Survey estimate |
| 18 | Marketers saying customers expect two-way conversations reached 83%. | 83% | 2026 report; 4,450 global marketing professionals | Survey perception |
| 19 | Sixty-nine percent struggled to respond promptly, while only 55% frequently replied through email or SMS. | 69%; 55% | 2026 report; 4,450 global marketing professionals | Survey estimate |
| 20 | Marketers trusting AI to respond to customer inquiries reached 81%. | 81% | 2026 report; 4,450 global marketing professionals | Survey sentiment |
Source for statistics 12 through 20: All figures come from Salesforce Tenth State of Marketing.
AI reaches three-quarters of organizations, though agentic use remains 13%. Full martech integration also remains unfinished for 61%. Broad access therefore says little about connected execution.
AI use spreads faster than full system integration
AI adoption currently outpaces integration, measurement, and operational control. Reported gains appear meaningful, but most evidence remains observational. Teams should treat associations as signals, not guaranteed causal lifts. Full integration requires data, process ownership, and reliable evaluation.
Salesforce reports gains alongside unfinished integration
Salesforce AI users reported stronger ROI, satisfaction, conversions, and lower costs. Those gains look promising, though the survey lacked randomized experiments.
Better-performing teams may already have stronger data foundations.
| # | Verified statistic | Key value | Period and denominator | Evidence type |
|---|---|---|---|---|
| 21 | AI users reported 20% higher marketing ROI, 20% higher satisfaction, 19% higher conversions, and 19% lower costs. | +20% ROI; +20% satisfaction; +19% conversions; -19% costs | 2026 report; Salesforce marketers reporting deployed AI | Surveyed reported impact |
| 22 | Marketers expected AI agents to return eight work hours weekly. | 8 hours per week | 2026 expectation; Salesforce marketers using or planning agents | Expectation |
| 23 | Marketing attrition was 14% without AI and 16% with AI. | 14% vs 16% | 2026 report; Marketing organizations grouped by AI use | Survey comparison |
| 24 | Seventy-one percent were satisfied connecting touchpoints, but only 26% were completely satisfied. | 71% satisfied; 26% completely | 2026 report; 4,450 global marketing professionals | Survey estimate |
| 25 | Full cross-functional data access reached 58% for service, 56% for sales, and 51% for commerce. | 58%; 56%; 51% | 2026 report; Global marketing teams | Survey estimate |
| 26 | AI marketers using predicted behavior for segmentation reached 41%, versus 30% without AI. | 41% vs 30% | 2026 report; Marketers with AI versus without AI | Survey association |
| 27 | Marketers with a clear view of sales-pipeline impact reached 83%. | 83% | 2026 report; Global marketer survey | Survey estimate |
| 28 | Companies marketed across ten customer-engagement channels on average. | 10 channels | 2026 report; Global marketer survey | Survey average |
| 29 | Marketers needing more personalized content than they could produce reached 78%. | 78% | 2026 report; Global marketer survey | Survey estimate |
| 30 | Among marketers using AI, 98% encountered at least one personalization barrier. | 98% | 2026 report; AI-using marketers | Survey estimate |
Source for statistics 21 through 30: All figures come from Salesforce Tenth State of Marketing.
Adobe finds content gains before organization-wide agent use
Adobe surveyed 3,000 customer-experience executives and practitioners. Its customer study also included 4,000 global consumers. Reported content and productivity improvements exceed current agent deployment.
Statistics 31 through 39 preserve that important difference.
| # | Verified statistic | Key value | Period and denominator | Evidence type |
|---|---|---|---|---|
| 31 | Generative AI improved content volume for 76% of surveyed organizations. | 76% | 2026 report; 3,000 CX executives and practitioners | Surveyed reported improvement |
| 32 | Generative AI improved non-creative content production for 70% and employee productivity for 69%. | 70%; 69% | 2026 report; 3,000 CX executives and practitioners | Surveyed reported improvement |
| 33 | Generative AI improved innovation for 67% and marketing-driven revenue growth for 65%. | 67%; 65% | 2026 report; 3,000 CX executives and practitioners | Surveyed reported improvement |
| 34 | Cloud infrastructure was present at 89% of organizations, while shared customer data platforms reached 71%. | 89%; 71% | 2026 report; Adobe business survey | Survey estimate |
| 35 | AI investment priorities were personalization 56%, satisfaction 46%, workflow automation 45%, data 32%, content 31%, and revenue 28%. | 56%; 46%; 45%; 32%; 31%; 28% | Next 18 months; 3,000 executives and practitioners | Investment priority survey |
| 36 | Digital customer-experience maturity was at or behind peers for 57%, while 36% saw themselves ahead. | 57%; 36% | 2026 report; Adobe business survey | Survey perception |
| 37 | Organization-wide agentic AI adoption reached 16% for customer support and 13% for brand discovery. | 16%; 13% | 2026 report; Adobe business survey | Survey estimate |
| 38 | Organizations expected agents to handle customer support 78%, post-purchase 70%, sales 69%, account management 63%, and engagement 62%. | 78%; 70%; 69%; 63%; 62% | Within 18 months; Adobe business survey | Expectation |
| 39 | Forty-nine percent of organizations expected agents as the primary brand interface, while only 19% of customers agreed. | 49% vs 19% | 2026 report; Organizations versus 4,000 customers | Expectation gap |
Source for statistics 31 through 39: All figures come from Adobe AI and Digital Trends 2026.
Content volume improved for 76%, while marketing-driven revenue improved for 65%. Both remain self-reported rather than audited financial changes. Increased output does not automatically create increased demand.
Organization-wide support adoption reaches 16%, while 78% expect agents to handle high volumes. That expectation gap requires clear handoffs, permissions, and exception rules.
Customers reward relevance but reject excessive personalization
Customers value relevant assistance, but irrelevant automation quickly loses trust. Repeated helpful interactions increase stated purchase influence. Excessive promotions and inaccurate personalization produce the opposite response. Automation quality matters more than message volume.
Repeated relevance influences more customers than one interaction
One personalized interaction readied 12%, while three to five influenced 40%. This measures stated influence rather than observed conversion. Consistent relevance still matters across longer customer journeys.
| # | Verified statistic | Key value | Period and denominator | Evidence type |
|---|---|---|---|---|
| 40 | One personalized interaction readied 12% to buy, while three to five interactions influenced 40%. | 12%; 40% | 2026 report; 4,000 global customers | Consumer survey |
| 41 | Too many promotions would stop 45% engaging, while irrelevant personalization would stop 50%. | 45%; 50% | 2026 report; 4,000 global customers | Consumer survey |
| 42 | Customers willing to use AI for recommendations reached 49%, while instant support reached 44%. | 49%; 44% | 2026 report; 4,000 global customers | Consumer survey |
| 43 | Seventy percent considered human-feeling automated recommendations important. | 70% | 2026 report; 4,000 global customers | Consumer survey |
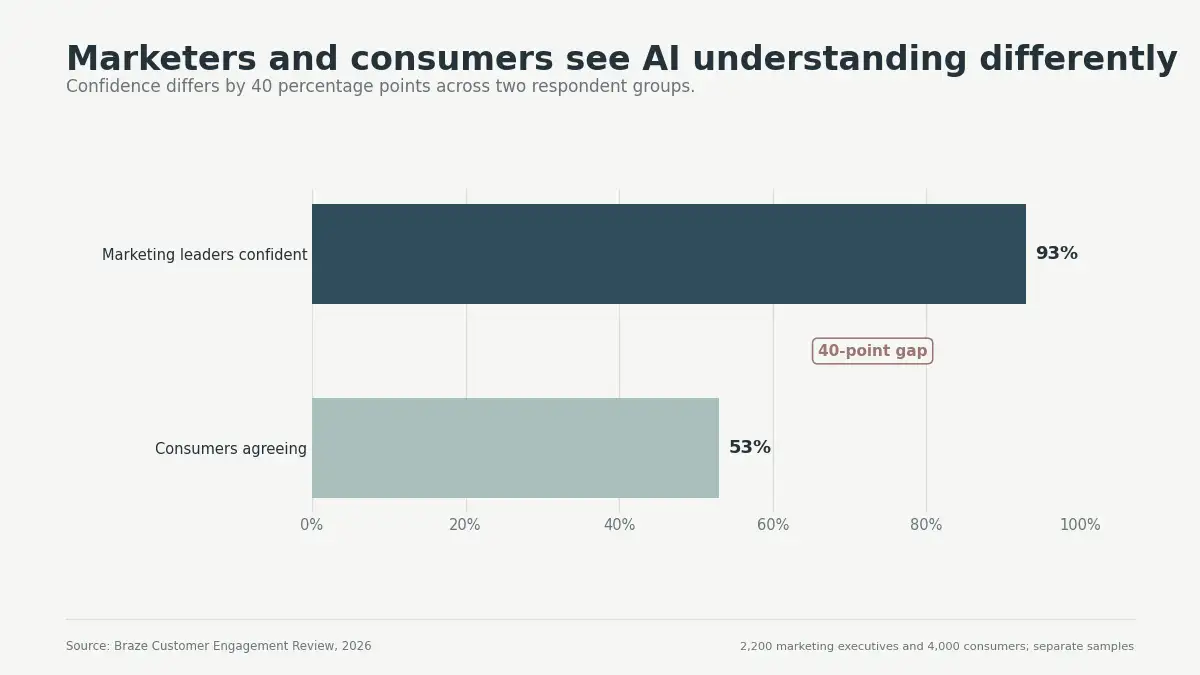
| 44 | Ninety-three percent of marketing leaders trusted AI customer understanding, but only 53% of consumers agreed. | 93% vs 53% | 2026 report; 2,200 marketing executives and 4,000 consumers | Perception gap |
| 45 | Sixty percent used AI for cross-channel personalization, 48% lacked orchestration tools, and only 55% updated information in real time. | 60%; 48%; 55% | 2026 report; B2C marketing leaders | Survey estimates |
Sources for statistics 40 through 45: Adobe Consumer Digital Trends 2026 supports statistics 40 through 43, while Braze Customer Engagement Review 2026 supports statistics 44 and 45.
Customers want recommendations that feel human, though brands should still disclose automation. Natural language and useful context can satisfy both needs.
Real-time data remains incomplete across many teams
Braze reports 60% using cross-channel AI, though 48% lack orchestration tools. Only 55% update customer information in real time. That mismatch can produce delayed or conflicting messages.
AI handles 24.17% of marketing activity today
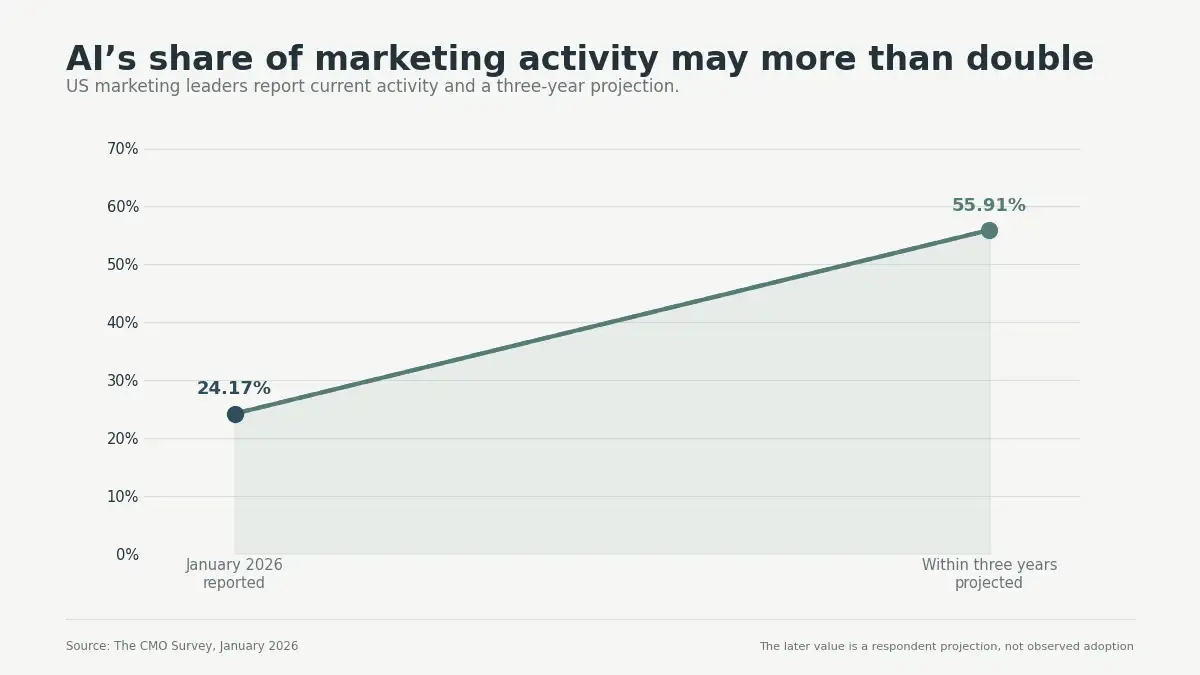
AI performs about one-quarter of reported marketing activities today. US marketing leaders expect that share exceeding half soon. Content creation and personalization remain the leading use cases. Programmatic buying currently trails most listed applications.
The CMO Survey measures activity share, not tool ownership
The CMO Survey contacted 2,111 US marketing leaders. It received 308 responses during January 2026. Ninety-seven percent of respondents held vice-president roles or higher. The resulting response rate was 14.6%.
| # | Verified statistic | Key value | Period and denominator | Evidence type |
|---|---|---|---|---|
| 46 | AI performed 24.17% of marketing activities, with 55.91% projected within three years. | 24.17% now; 55.91% projected | January 2026; three-year outlook; 308 US marketing leaders | Survey mean and forecast |
| 47 | AI use cases included content creation 73.9%, personalization 65.4%, and ROI optimization 49.5%. | 73.9%; 65.4%; 49.5% | January 2026; 188 valid cases answering AI-use question | Multi-select survey |
| 48 | AI use included marketing automation 48.9%, data analysis 46.3%, and targeting 45.2%. | 48.9%; 46.3%; 45.2% | January 2026; 188 valid cases | Multi-select survey |
| 49 | Predictive analytics and GEO each reached 41.5%, conversational AI 39.9%, and programmatic buying 32.4%. | 41.5%; 41.5%; 39.9%; 32.4% | January 2026; 188 valid cases | Multi-select survey |
| 50 | AI improved sales productivity 14.06%, reduced marketing overhead 14.64%, and improved satisfaction 10.75%. | +14.06%; -14.64%; +10.75% | January 2026; 152 to 160 valid cases by outcome | Surveyed reported impact |
| 51 | Top martech barriers were budget 20.1%, integration 19.1%, bandwidth 14.1%, and talent 13.1%. | 20.1%; 19.1%; 14.1%; 13.1% | January 2026; 199 valid cases | Survey estimate |
| 52 | Digital capability indicators were roadmap knowledge 66.5%, testing 60.5%, tech collaboration 55.7%, skills 49.7%, and unified intelligence 30.3%. | 66.5%; 60.5%; 55.7%; 49.7%; 30.3% | January 2026; 185 valid cases | Multi-select survey |
| 53 | Marketing expenses averaged 9.64% of company budgets and 8.96% of revenue. | 9.64% of budgets; 8.96% of revenue | January 2026; 146 and 154 valid cases | Survey mean |
Source for statistics 46 through 53: All figures come from The CMO Survey 2026.
The 55.91% three-year figure is a forecast, not completed automation. Costs, regulation, and performance could shift that projection. Current activity share provides the safer operating baseline.
The survey reports 14.06% higher sales productivity from AI. It also reports 14.64% lower marketing overhead. Customer satisfaction improved by 10.75% on average. These means come from 152 to 160 valid responses.
Those findings are fresher than 2012 benchmarks, though they lack controlled counterfactuals. Company size and industry can also change results. Teams should benchmark against their own historical performance.
Roadmap knowledge reached 66.5% across responding marketing leaders. Testing capabilities reached 60.5%, while collaboration reached 55.7%. Only 30.3% reported unified customer intelligence. Data unification therefore trails planning and experimentation.
AI receives 15.3% of budgets, but readiness reaches 30%
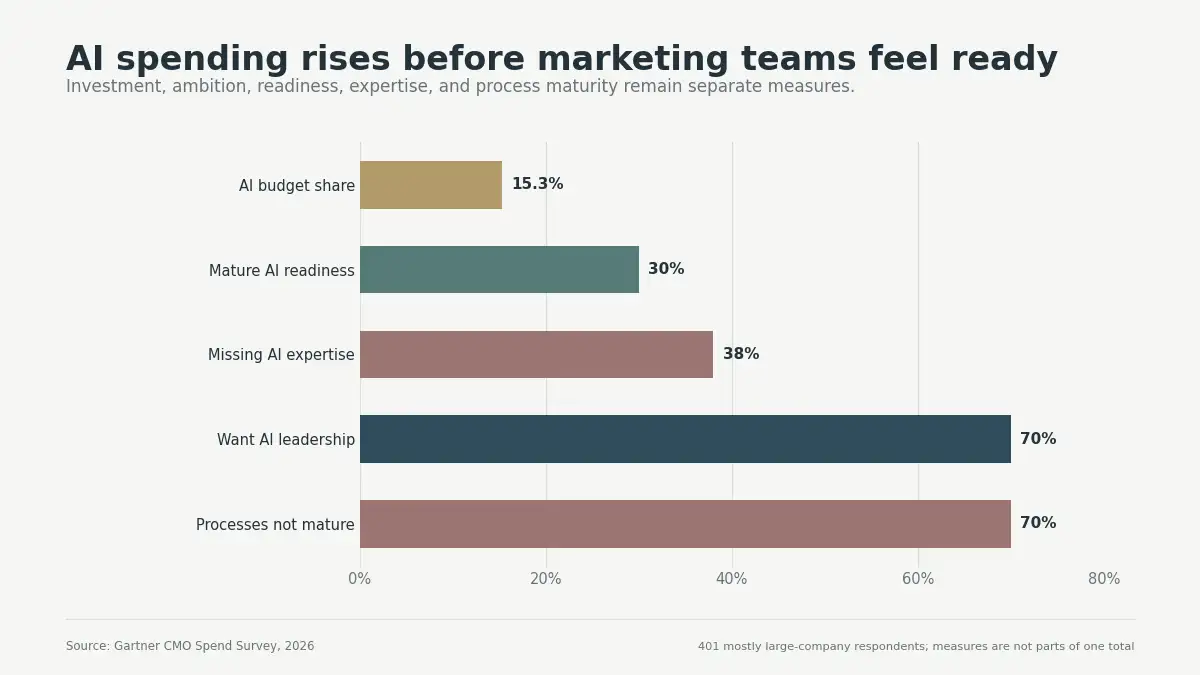
Marketing teams fund AI faster than they build readiness. Gartner finds 15.3% of budgets fund AI, while mature readiness reaches 30%. Ambition and operational preparedness remain sharply separated.
AI-ready teams spend more across marketing operations
Gartner surveyed 401 CMOs and marketing leaders during 2026. Most respondents represented large North American and European companies. The sample therefore does not represent every small business. Statistics 54 through 58 retain that scope.
| # | Verified statistic | Key value | Period and denominator | Evidence type |
|---|---|---|---|---|
| 54 | CMOs allocated 15.3% of marketing budgets to AI, while only 30% had mature readiness. | 15.3%; 30% | January-March 2026; 401 CMOs and marketing leaders | Survey estimate |
| 55 | Seventy percent wanted AI leadership, while 70% said internal processes were not mature enough. | 70%; 70% | 2026; 401 CMOs and marketing leaders | Survey estimate |
| 56 | AI-ready teams allocated 21.3% to AI versus 15.3% overall, with total budgets at 8.9% versus 7.8% of revenue. | 21.3% vs 15.3%; 8.9% vs 7.8% | 2026; Gartner AI-ready subgroup versus full survey | Survey comparison |
| 57 | Fifty-six percent lacked budget for strategy, while 54% reported insufficient resources. | 56%; 54% | 2026; 401 CMOs and marketing leaders | Survey estimate |
| 58 | Labor took 24.5% of marketing budgets, up from 21.9%, while 38% cited missing AI expertise. | 24.5% vs 21.9%; 38% | 2025 to 2026; 401 Gartner CMO respondents | Survey trend |
Sources for statistics 54 through 58: Gartner CMO Spend Survey supports statistics 54 through 57, while Gartner media and labor findings supports statistic 58.
AI-ready teams allocate 21.3% toward AI, while the full sample allocates 15.3%. Ready teams also hold larger overall revenue shares. These associations do not prove that spending creates readiness.
Labor’s budget share rose from 21.9% to 24.5%, while 38% lack AI expertise. Automation still requires analysts, operators, reviewers, and process owners. Software spending cannot replace those operating capabilities.
Martech stacks are expanding while replacement rates fall
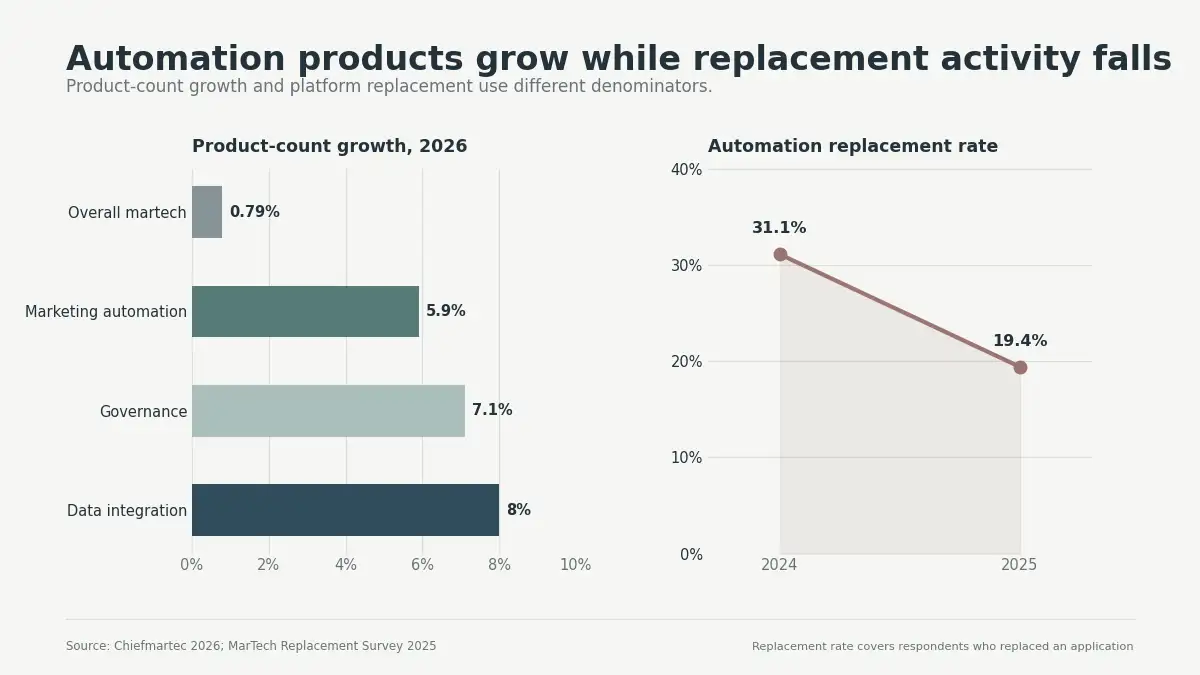
Martech stacks keep expanding, while automation replacement rates keep falling. Buyers increasingly weigh AI capabilities against operating costs. The overall landscape has nearly stopped growing, though several categories still expand.
Stack presence comes from a small community sample
MarTech’s stack survey included 169 marketing operations respondents. Marketing automation appeared within 76.9% of their stacks. Generative AI appeared within 68.6% of those stacks. This convenience sample cannot represent every business.
| # | Verified statistic | Key value | Period and denominator | Evidence type |
|---|---|---|---|---|
| 59 | Marketing automation appeared in 76.9% of surveyed martech stacks, while generative AI appeared in 68.6%. | 76.9%; 68.6% | 2025 survey; 169 martech and marketing operations respondents | Community survey |
| 60 | Stacks used more tools for 62.1%, the same number for 23.1%, and fewer tools for 14.8%. | 62.1%; 23.1%; 14.8% | 2025 survey; 169 martech respondents | Community survey |
| 61 | Planned AI additions included content generation 55.6%, personalization 46.2%, and automated tasks 43%. | 55.6%; 46.2%; 43% | Next 12-24 months; 169 martech respondents | Community survey |
| 62 | Marketing automation replacement fell to 19.4% from 31.1%. | 31.1% to 19.4% | 2024 to 2025; 154 respondents replacing a martech application | Community survey trend |
| 63 | AI capabilities influenced 37.1% of replacement decisions, 33.9% wanted AI, and 12.1% used AI-built replacements. | 37.1%; 33.9%; 12.1% | 2025; 154 application replacers | Community survey |
| 64 | Cost reduction drove 43.8% of commercial replacements, up from 23.0%. | 23.0% to 43.8% | 2024 to 2025; Commercial martech replacers | Community survey trend |
| 65 | Martech stacks increased for 58.9% and decreased for 22.5% of respondents. | 58.9%; 22.5% | 2025; MarTech replacement survey respondents | Community survey |
Sources for statistics 59 through 65: MarTech State of Your Stack supports statistics 59 through 61, while MarTech Replacement Survey supports statistics 62 through 65.
Most respondents added tools, while the automation replacement rate fell from 31.1% to 19.4%. That denominator only covers respondents replacing an application. It does not describe every automation platform customer.
Cost reduction now drives more commercial platform replacements. AI capabilities also influence over one-third of decisions. Buyers may extend existing platforms before accepting migration risk. Replacement costs include data, integrations, training, and downtime.
Also read: AI Statistics In 2026
The martech landscape plateau hides category growth
Chiefmartec counted 15,505 commercial products during 2026, though growth was only 0.79%. Marketing automation grew 5.9%, while integration and governance grew faster.
| # | Verified statistic | Key value | Period and denominator | Evidence type |
|---|---|---|---|---|
| 66 | The martech product count reached 15,505, rising only 0.79%. | 15,505; +0.79% | 2026; Chiefmartec commercial product landscape | Curated market inventory |
| 67 | The landscape added 1,488 products and removed 1,367; new entrants fell 40%. | 1,488 added; 1,367 removed; -40% entrants | 2026; Chiefmartec product landscape | Curated market inventory |
| 68 | Marketing automation products grew 5.9%, data integration 8.0%, governance 7.1%, and mobile/web analytics 11.3%. | 5.9%; 8.0%; 7.1%; 11.3% | 2026; Chiefmartec product categories | Curated market inventory |
Source for statistics 66 through 68: All figures come from Chiefmartec State of Martech 2026.
The landscape added 1,488 products and removed 1,367. New entrants fell by 40% during the year. This churn suggests consolidation without complete market contraction. Product counts do not measure installed use or revenue.
Extending current platforms can reduce migration and retraining costs. Buying specialized tools may improve one constrained workflow. Internal builds provide control but require durable maintenance teams. Each option needs the same evaluation framework.
Marketing automation ROI looks positive, but benchmarks need dates
Marketing automation often produces positive returns, but evidence quality varies. The famous $5.44 return figure is not current. It came from sixteen case studies published during 2016 through 2020. Current teams need counterfactual measurement and complete cost accounting.
The $5.44 benchmark describes older selected cases
Nucleus published its marketing automation analysis during March 2021. The study synthesized sixteen earlier return-on-investment case studies. Reported payback occurred within six months across those cases. Selection and survivorship effects may influence the average.
| # | Verified statistic | Key value | Period and denominator | Evidence type |
|---|---|---|---|---|
| 69 | Marketing automation returned $5.44 per dollar with payback under six months. | $5.44 per $1; under 6 months | 2021 study; 16 ROI case studies published from 2016 to 2020 | Case-study synthesis |
| 70 | Nucleus cases averaged 225% more leads, 54% more campaigns, 32% higher opens, and 361% more subscribers. | +225%; +54%; +32%; +361% | 2016-2020 cases; published 2021; 16 marketing automation ROI cases | Case-study synthesis |
| 71 | One market forecast valued marketing automation at $8.4 billion in 2026 and $15.6 billion by 2030. | $8.4B; $15.6B | 2026 estimate; 2030 forecast; Global marketing automation software market | Analyst forecast |
| 72 | The same forecast put North America at 43.6% of 2024 revenue, email at 26.7%, and analytics CAGR at 18.4%. | 43.6%; 26.7%; 18.4% CAGR | 2024 actual/estimate; 2025-2030 forecast; Global marketing automation market segments | Analyst estimate and forecast |
Sources for statistics 69 through 72: Nucleus Research supports statistics 69 and 70, while Grand View Research supports statistics 71 and 72.
The cases reported large gains, though they are not universal 2026 benchmarks. Platform capabilities, privacy rules, and channel economics changed considerably. Keep the study year visible whenever citing them.
Market forecasts use incompatible product boundaries
Grand View Research estimates an $8.4 billion market during 2026. It forecasts $15.6 billion by 2030. Other publishers report very different market totals. Their definitions may include services, advertising, analytics, or broader software.
Verdict: use one named forecast with its exact scope. Never average estimates built from different market definitions. Forecasts also represent modeled futures, not audited revenue. Readers need the publisher and forecast period.
Incremental ROI requires a credible counterfactual
Platform-attributed revenue rarely equals genuinely incremental revenue. Customers may have purchased without receiving automated messages. Holdout groups estimate that missing counterfactual more reliably. Matched cohorts offer a weaker practical alternative.
Use this calculation for comparable automation programs:
Incremental ROI = (incremental gross profit - total automation cost) / total automation cost
Include software, implementation, data work, content, training, and governance. Subtract discounts, returns, and expected baseline purchases. Use gross profit instead of top-line revenue. Review attribution windows before accepting platform reports.
A simple measurement plan should include these fields:
| Input | Recommended definition |
|---|---|
| Eligible audience | Customers meeting the workflow’s documented entry rules |
| Treatment group | Eligible customers receiving the automated experience |
| Holdout group | Comparable customers receiving no new automated treatment |
| Incremental revenue | Treatment revenue minus expected holdout-equivalent revenue |
| Incremental gross profit | Incremental revenue multiplied by contribution margin |
| Total automation cost | Software, labor, data, content, services, and governance |
| Payback period | Time required for cumulative incremental profit covering costs |
| Quality adjustment | Returns, complaints, discounts, and service costs after treatment |
Automated email flows outperform campaigns because intent is higher
Automated email flows outperform campaigns, though recipients often show stronger intent. That selection effect explains part of the measured difference. Automation alone does not cause every reported lift.
Klaviyo finds flows concentrate clicks, orders, and revenue
Klaviyo’s 2026 benchmarks cover more than 183,000 brands. This large platform dataset primarily reflects ecommerce and B2C senders. Campaigns and flows use different audience selection rules. Statistics 73 through 80 preserve those channel distinctions.
| # | Verified statistic | Key value | Period and denominator | Evidence type |
|---|---|---|---|---|
| 73 | Klaviyo analyzed email benchmarks from more than 183,000 brands. | 183,000+ brands | 2026 benchmark; Klaviyo customer brands | Platform behavioral dataset |
| 74 | Campaign open rates averaged 31%, while the top tenth reached 45.1%. | 31%; 45.1% | 2026 benchmark; Klaviyo email campaigns | Platform benchmark |
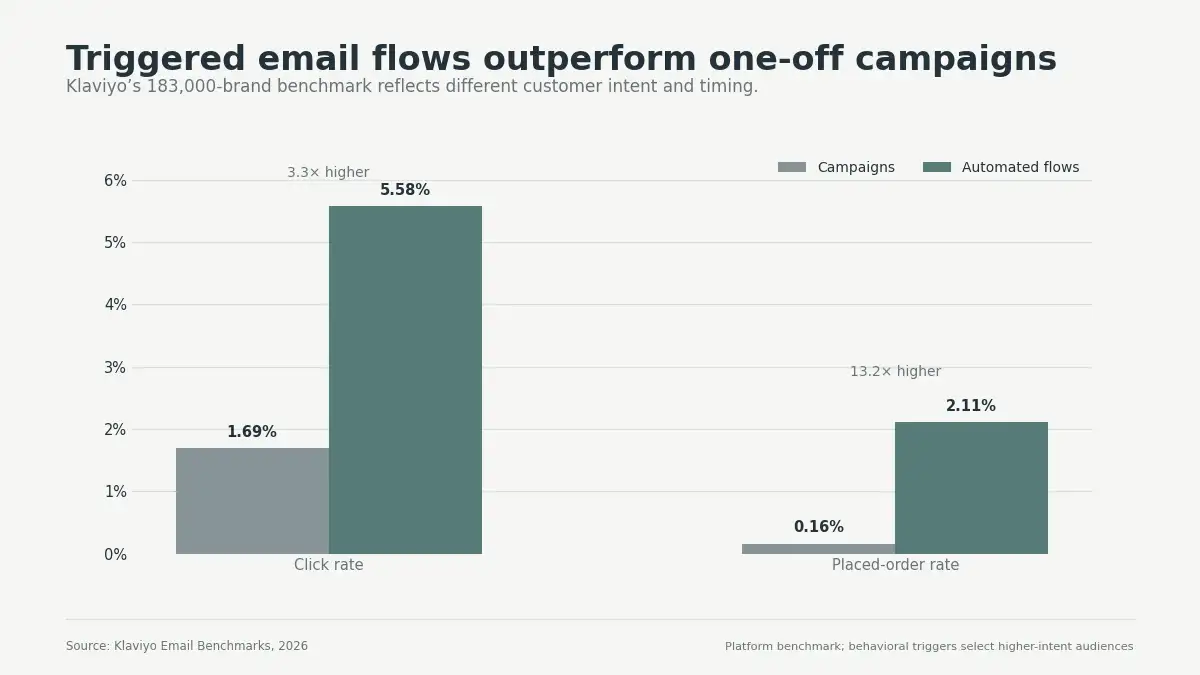
| 75 | Campaign click rates averaged 1.69%, while the top tenth reached 3.38%. | 1.69%; 3.38% | 2026 benchmark; Klaviyo email campaigns | Platform benchmark |
| 76 | Automated-flow click rates averaged 5.58%, while the top tenth reached 10.48%. | 5.58%; 10.48% | 2026 benchmark; Klaviyo automated email flows | Platform benchmark |
| 77 | Campaign placed-order rates averaged 0.16%, while the top tenth reached 0.36%. | 0.16%; 0.36% | 2026 benchmark; Klaviyo email campaigns | Platform benchmark |
| 78 | Automated-flow placed-order rates averaged 2.11%, while the top tenth reached 4.3%. | 2.11%; 4.3% | 2026 benchmark; Klaviyo automated email flows | Platform benchmark |
| 79 | Email flows produced roughly three times higher clicks and thirteen times higher order rates. | ~3x clicks; ~13x orders | 2026 benchmark; Klaviyo flows versus campaigns | Derived platform comparison |
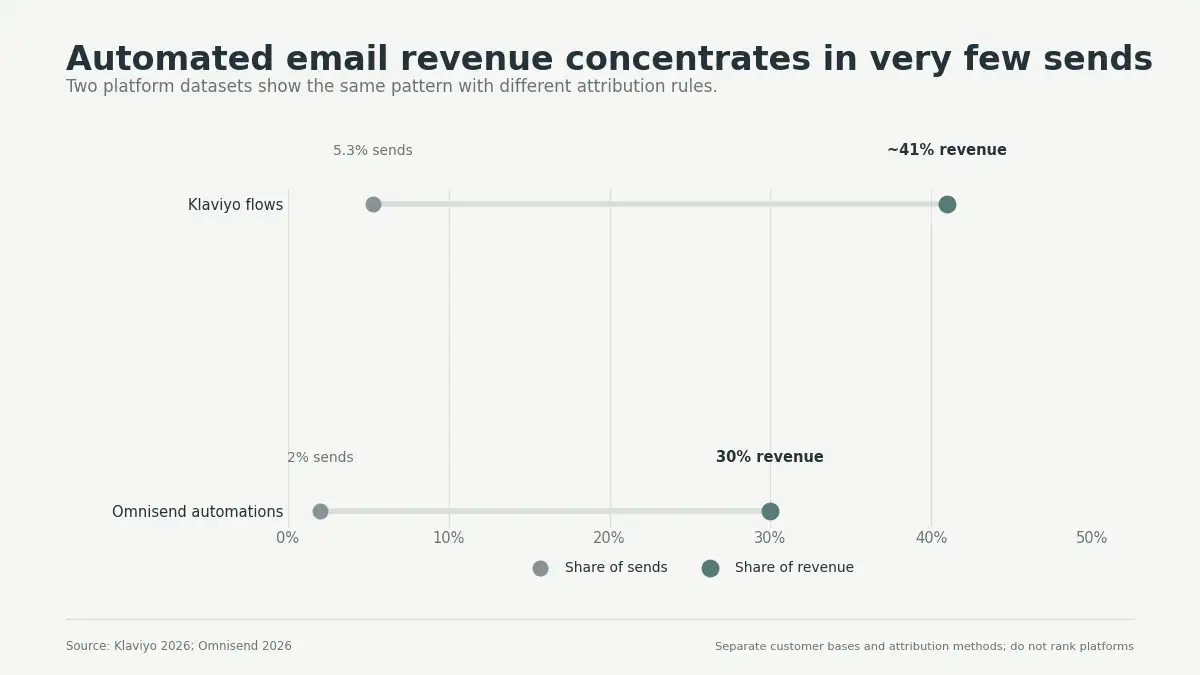
| 80 | Email flows generated nearly 41% of email revenue from 5.3% of sends. | ~41% revenue; 5.3% sends | 2026 benchmark; Klaviyo email flows | Platform benchmark |
Source for statistics 73 through 80: All figures come from Klaviyo Email Benchmarks 2026.
Flows generate nearly 41% of revenue from only 5.3% of sends. That concentration supports prioritizing high-intent automated journeys. It does not support sending more messages indiscriminately.
Strong starting workflows include these customer moments:
- Welcome new subscribers with expected value and preferences.
- Recover abandoned browsing sessions without excessive reminders.
- Recover carts using accurate inventory and pricing.
- Explain products after purchase and reduce returns.
- Request reviews after realistic product-use periods.
- Remind customers before predictable replenishment windows.
- Reengage inactive customers using strict suppression rules.
Apple privacy features can inflate opens through device preloading. Clicks provide stronger engagement signals, while incremental orders show commercial impact.
Benchmark teams should track both rate and volume. A high rate from tiny audiences may create little profit. A lower rate across larger eligible groups can matter more. Holdouts remain necessary for judging incremental orders.
SMS flows generate 45.2% of revenue from 7.6% of sends
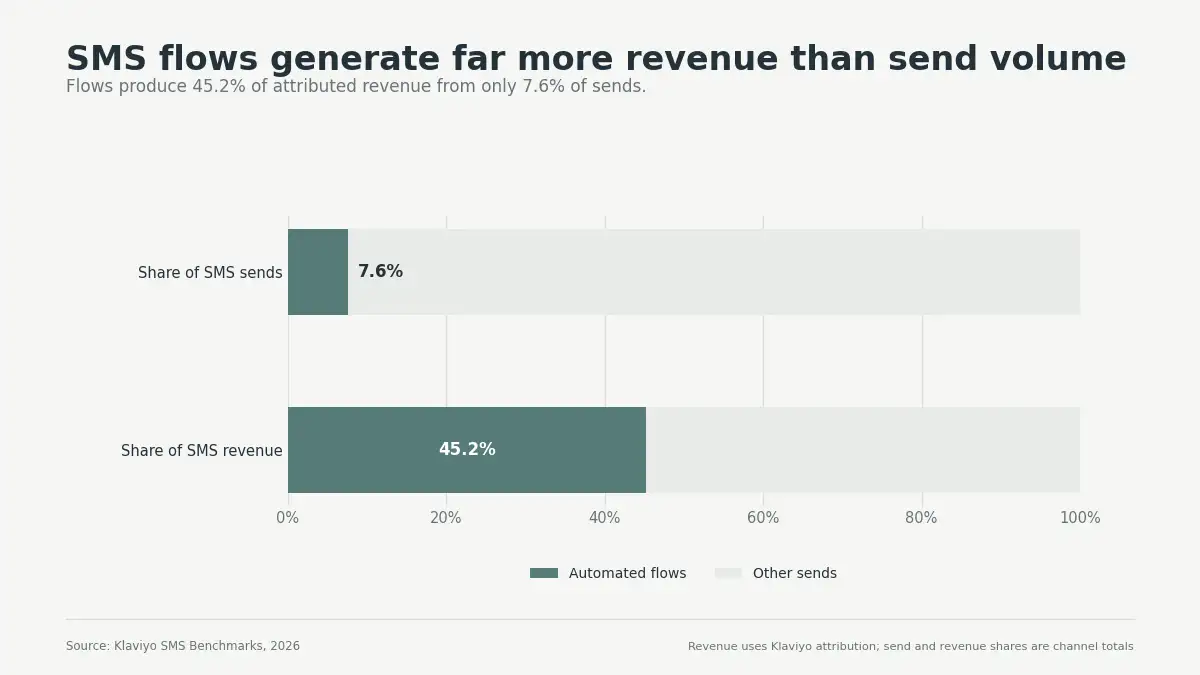
SMS automation produces disproportionate attributed revenue from fewer messages. Klaviyo flows generated 45.2% of measured SMS revenue. Those flows represented only 7.6% of channel sends. Consent and timing remain essential for sustaining performance.
High-intent triggers explain much SMS flow performance
Klaviyo reports 10% average flow clicks, while top performers exceed 16%. New buyers generate 64.4% of flow revenue, versus 20% for campaigns.
| # | Verified statistic | Key value | Period and denominator | Evidence type |
|---|---|---|---|---|
| 81 | SMS flows produced 45.2% of SMS revenue from only 7.6% of sends. | 45.2% revenue; 7.6% sends | 2026 benchmark; 183,000+ Klaviyo customer brands | Platform benchmark |
| 82 | SMS flow click rates approached 10% on average, while top performers exceeded 16%. | ~10%; >16% | 2026 benchmark; Klaviyo SMS flows | Platform benchmark |
| 83 | New buyers generated 64.4% of SMS flow revenue, versus 20% for campaigns. | 64.4% vs 20% | 2026 benchmark; Klaviyo SMS revenue | Platform benchmark |
| 84 | SMS flows produced about eight times campaign revenue per recipient, while top flows exceeded $5. | ~8x; >$5 RPR | 2026 benchmark; Klaviyo SMS flows and campaigns | Platform benchmark |
Source for statistics 81 through 84: All figures come from Klaviyo SMS Benchmarks 2026.
SMS messages interrupt customers more directly than email. Teams should require explicit, channel-specific consent. Quiet hours need local-time enforcement across every market. STOP requests should suppress sending without delay.
Frequency caps should cover campaigns and automated flows together. Separate tools can accidentally exceed customer-level limits. Central suppression rules help prevent overlapping messages. Human review remains sensible for sensitive offers.
Triggered ecommerce emails create more revenue per send
Triggered ecommerce emails produce more revenue per send, though intent shapes comparisons. Omnisend finds 30% of revenue from 2% of sends. Platform attribution also differs from incremental measurement.
Omnisend confirms strong automation performance across many brands
Omnisend analyzed activity from approximately 150,000 ecommerce brands. The analysis covers 2025 activity published during 2026. Its metrics compare automated messages with scheduled campaigns. Statistics 85 through 91 reflect its customer base.
| # | Verified statistic | Key value | Period and denominator | Evidence type |
|---|---|---|---|---|
| 85 | Omnisend’s 2026 email analysis covered approximately 150,000 brands. | ~150,000 brands | 2025 activity; published 2026; Omnisend ecommerce brands | Platform behavioral dataset |
| 86 | Automated emails produced 30% of revenue from 2% of sends and earned sixteen times more per send. | 30% revenue; 2% sends; 16x | 2025 activity; Omnisend automated emails versus campaigns | Platform benchmark |
| 87 | Automated emails generated $2.87 per send, compared with $0.18 for campaigns. | $2.87 vs $0.18 | 2025 activity; Omnisend email sends | Platform benchmark |
| 88 | Automations recorded 24% higher opens, six times more clicks, and nineteen times higher conversions. | +24% opens; 6x clicks; 19x conversions | 2025 activity; Omnisend automations versus scheduled campaigns | Platform benchmark |
| 89 | Nearly one in three automated-email clicks resulted in a purchase. | ~1 in 3 | 2025 activity; Omnisend automated email clicks | Platform conversion benchmark |
| 90 | Roughly one in two welcome or cart-recovery clicks resulted in purchase. | ~1 in 2 | 2025 activity; Omnisend welcome and cart email clicks | Platform conversion benchmark |
| 91 | Welcome and abandoned-cart messages generated 76% of automation-related orders. | 76% | 2025 activity; Omnisend automation orders | Platform benchmark |
Source for statistics 85 through 91: All figures come from Omnisend Ecommerce Marketing Report 2026.
Automated messages earned $2.87 per send on average. Campaigns generated eighteen cents per send. Automations also recorded six times more clicks. Conversion rates reached nineteen times campaign levels.
Welcome and cart messages dominate automation-generated orders. These workflows captured 76% of Omnisend’s automated orders. Their audiences possess fresh subscription or purchase intent. Teams should not generalize that lift across every workflow.
Mailchimp analyzed automation flows and coordinated email-plus-SMS usage. Its internal periods ran between 2023 and early 2025. The phrases “up to” and “higher” require careful retention. They do not describe every customer account.
| # | Verified statistic | Key value | Period and denominator | Evidence type |
|---|---|---|---|---|
| 92 | Mailchimp automation-flow users generated up to nine times more revenue, while email-plus-SMS users saw 97% higher click rates. | Up to 9x revenue; +97% clicks | Jan 2023-Jan 2025; Aug 2023-Jan 2025; Mailchimp platform users | Vendor platform analysis |
Source for statistic 92: This figure comes from Mailchimp Ecommerce Marketing Tools.
Combined channels can create broader reach and faster responses. They can also increase fatigue without shared frequency controls. Coordinate exclusions before adding another channel. Measure customer-level outcomes across both channels together.
Paid-media automation delivers gains, but oversight remains essential
Paid-media automation now supports planning, creative, bidding, and attribution. Buyers still request human oversight, audit trails, and guardrails. Platform vendors report meaningful gains from automated products. Those internal benchmarks cannot guarantee individual account performance.
IAB finds agentic buying moving from research into production
IAB surveyed more than 200 US brand and agency buyers. Its 2026 outlook combines spending forecasts with buyer priorities. Later video research tracks creative automation and agentic stages. Statistics 93 through 101 retain those evidence types.
| # | Verified statistic | Key value | Period and denominator | Evidence type |
|---|---|---|---|---|
| 93 | US ad spending was projected to grow 9.5%, versus 5.7% in 2025; event-adjusted growth was 7.1%-7.8%. | +9.5%; +5.7%; +7.1%-7.8% | 2026 forecast; 200+ US brand and agency buyers | Buyer survey forecast |
| 94 | Social media spending was forecast up 14.6%, connected TV 13.8%, and commerce media 12.1%. | +14.6%; +13.8%; +12.1% | 2026 forecast; US advertising market | Buyer survey forecast |
| 95 | Five of six top buyer focus areas involved AI, two-thirds focused on agentic buying, and 96% knew agentic buying. | 5 of 6; ~67%; 96% | 2026 outlook; US brand and agency buyers | Buyer survey |
| 96 | Cross-platform measurement focus reached 72%, up from 64%. | 64% to 72% | 2025 to 2026; US brand and agency buyers | Buyer survey trend |
| 97 | US digital video spending was projected above $80 billion, up 11%, exceeding 60% of TV/video spending. | >$80B; +11%; >60% share | 2026 forecast; US digital video market | Industry forecast |
| 98 | Agentic video use was live for 21%, testing for 20%, planned for 25%, and investigated by 28%. | 21%; 20%; 25%; 28% | 2026; US digital video buyers | Buyer survey |
| 99 | Nearly two-thirds used generative AI for video creative; one-third of assets used it, projected to 43% by 2027. | ~67%; ~33%; 43% | 2026; 2027 forecast; US digital video buyers | Buyer survey and forecast |
| 100 | Inventory-quality confidence was weak for 43% of direct buyers, 55% of private-marketplace buyers, and 67% of open-exchange buyers. | 43%; 55%; 67% | 2026; US digital video buyers | Buyer survey |
| 101 | Agentic-ad buyers wanted human oversight 40%, audit trails 36%, and action guardrails 31%. | 40%; 36%; 31% | 2026; US digital video buyers | Buyer survey |
Sources for statistics 93 through 101: IAB 2026 Outlook Study supports statistics 93 through 96, while IAB Digital Video Ad Spend 2026 supports statistics 97 through 101.
Weak confidence rises from 43% in direct buying to 67% in exchanges. Automation requires quality controls alongside bidding efficiency.
Desired controls include human review and detailed audit trails. Buyers also want firm boundaries around agent actions. These controls should exist before agents change budgets. Reversible actions reduce the cost of unexpected behavior.
Google reports feature lifts from internal advertiser data
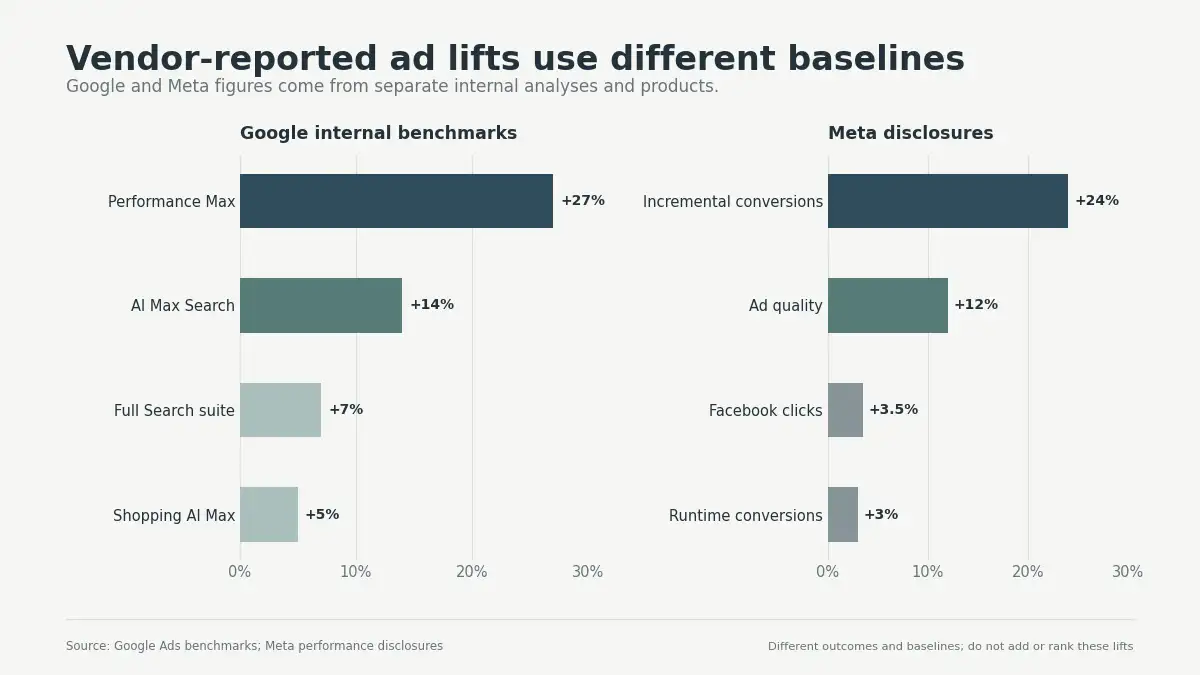
Google publishes internal benchmarks for AI Max and Performance Max. These findings compare defined feature groups under platform conditions. They are useful product signals, not independent experiments. Results vary across accounts, objectives, and conversion quality.
| # | Verified statistic | Key value | Period and denominator | Evidence type |
|---|---|---|---|---|
| 102 | AI Max for Search produced 14% more conversions or conversion value at similar CPA or ROAS. | +14% | 2025 internal data; Non-retail Google advertisers activating AI Max | Vendor internal benchmark |
| 103 | The full AI Max Search feature set produced 7% more conversions than search-term matching alone. | +7% | 2026 internal data; Hundreds of thousands of global Google advertisers | Vendor internal benchmark |
| 104 | AI Max for Shopping produced about 5% more conversions or value at similar CPA or ROAS. | +5% | 2026 internal data; Global retail advertisers | Vendor internal benchmark |
| 105 | Performance Max produced 27% more conversions or value, while URL expansion added 9% and video assets added 12%. | +27%; +9%; +12% | Current Google benchmark; Google advertisers | Vendor internal benchmarks |
Sources for statistics 102 through 105: Google AI Max Search supports statistic 102, while the Google AI Max 2026 update supports statistic 103. Google AI Max Shopping supports statistic 104, while Google Performance Max supports statistic 105.
Google reports 14% for Search, while Shopping averages about 5%. The full Search suite adds 7% beyond matching alone. These percentages use separate tests and cannot be added.
Performance Max reports 27%, while URL and video tests remain separate. Their baselines and advertiser groups may differ. Account tests should preserve those exact feature boundaries.
Meta reports ranking and attribution improvements internally
Meta disclosed several improvements from advertising system changes. Metrics include clicks, conversions, quality, and incremental attribution. Different baselines prevent one combined performance total. Statistics 106 and 107 retain each reported measure.
| # | Verified statistic | Key value | Period and denominator | Evidence type |
|---|---|---|---|---|
| 106 | Meta ad-ranking changes raised Facebook clicks 3.5%, Instagram conversions over 1%, runtime conversions 3%, and ad quality 12%. | +3.5%; >1%; +3%; +12% | Q4 2025; Meta advertising systems | Company disclosure |
| 107 | Meta incremental attribution raised incremental conversions 24%; Advantage+ returned $4.52 per dollar, 22% above traditional campaigns. | +24%; $4.52 per $1; +22% | Q4 2025 and prior internal analysis; Meta advertisers | Company disclosure |
Sources for statistics 106 and 107: Meta AI performance update supports statistic 106, while Meta Advantage+ analysis supports statistic 107.
Advantage+ returned $4.52 per dollar, beating traditional campaigns by 22%. That figure depends on Meta’s internal analysis and attribution. Independent lift tests provide stronger account-level evidence.
B2B marketers use AI widely, but maturity remains limited
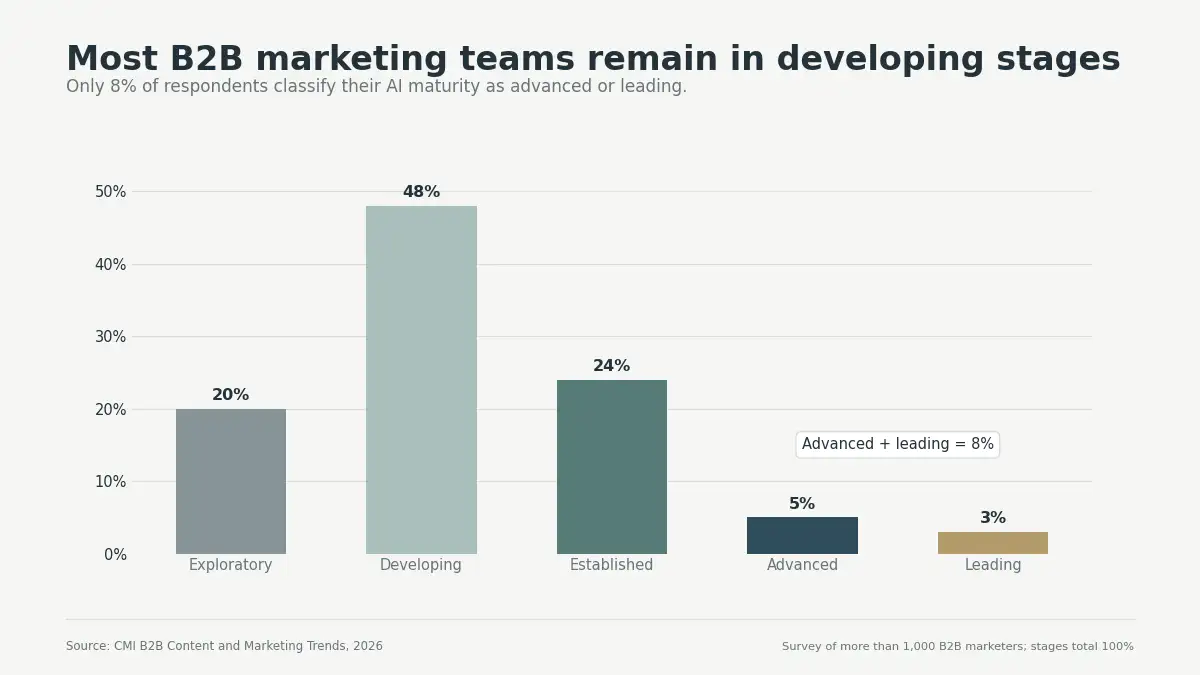
B2B AI use is widespread, while organizational maturity remains uneven. CMI finds 95% using applications, though only 8% are advanced or leading. Most teams remain exploratory, developing, or established.
Content tools lead B2B automation use cases
CMI’s 2026 research includes more than 1,000 B2B marketers. AI tools most commonly support content creation and creative work. Advertising optimization ranks lowest among the listed applications. Statistics 108 through 114 retain each multi-select denominator.
| # | Verified statistic | Key value | Period and denominator | Evidence type |
|---|---|---|---|---|
| 108 | B2B organizations using AI-powered marketing applications reached 95%; implementation was 20% exploratory, 48% developing, 24% established, 5% advanced, and 3% leading. | 95%; 20/48/24/5/3% stages | 2026 report; 1,000+ B2B marketers | Survey estimate |
| 109 | B2B AI tools covered content 89%, creative 53%, SEO 41%, social 38%, email 36%, research 35%, chatbots 28%, and ads 16%. | 89%; 53%; 41%; 38%; 36%; 35%; 28%; 16% | 2026 report; B2B marketers using AI applications | Multi-select survey |
| 110 | B2B marketers reported improved productivity 87%, efficiency 80%, creative capability 65%, and content performance 39%. | 87%; 80%; 65%; 39% | 2026 report; B2B marketers using AI-assisted content creation | Surveyed reported impact |
| 111 | B2B marketers experimenting with AI agents reached 28%, rising to 43% among pacesetters. | 28%; 43% | 2026 report; All B2B marketers versus mature AI users | Survey comparison |
| 112 | B2B personalization was basic for 59%, moderate for 35%, and extensive for only 5%. | 59%; 35%; 5% | 2026 report; B2B marketers | Survey estimate |
| 113 | Planned B2B investment increases favored AI tools 45%, events 33%, owned media 32%, paid media 25%, personalization 24%, and infrastructure 21%. | 45%; 33%; 32%; 25%; 24%; 21% | 2026 planned investment; B2B marketers | Multi-select survey |
| 114 | B2B first-party data came from direct engagement 77%, content collection 68%, CRM interactions 63%, and behavioral signals 52%. | 77%; 68%; 63%; 52% | 2026 report; 1,000+ B2B marketers | Multi-select survey |
Source for statistics 108 through 114: All figures come from CMI B2B Content and Marketing Trends 2026.
Productivity improves for 87%, while efficiency improves for 80%. Content performance reaches 39%, trailing those operational gains. More content does not guarantee stronger content.
Agent experimentation rises with organizational maturity
Twenty-eight percent experiment with agents, while 43% of pacesetters do. CMI groups established, advanced, and leading teams as pacesetters. The relationship remains associative rather than causal.
Personalization maturity remains modest across B2B respondents. Fifty-nine percent report basic personalization, while 35% report moderate maturity. Only 5% report extensive personalization capabilities.
Direct engagement supplies data for 77% of B2B marketers. Content collection contributes 68%, while CRM interactions contribute 63%. Behavioral signals contribute data for another 52%. These overlapping sources still require identity and consent controls.
Customers demand control, while Indian marketers move faster
Customers expect relevance, control, disclosure, and responsible data use. Indian marketers report faster AI adoption, though conversational pressure also rises. Data access still limits personalization across both groups.
Trust falls quickly after data misuse
Braze finds 27% refusing agent data sharing, while 43% would leave after misuse. Accurate need prediction can strengthen stated loyalty and recommendations. Trust therefore depends on accuracy, restraint, and permission.
| # | Verified statistic | Key value | Period and denominator | Evidence type |
|---|---|---|---|---|
| 115 | Top-performing brands were 30% more likely to use AI for anticipating purchase intent. | 30% more likely | 2026 report; Top-performing Braze customer cohort | Behavioral and survey association |
| 116 | Twenty-seven percent refused any data sharing with agents, while 43% would stop engaging after data misuse. | 27%; 43% | 2026 report; 4,000 consumers in US and UK | Consumer survey |
| 117 | Accurate need prediction increased stated loyalty likelihood 30% and recommendation likelihood 26%. | +30%; +26% | 2026 report; Braze consumer survey | Survey association |
| 118 | Consumer use of AI agents for brand interactions was 19%, projected to reach 46% by year-end. | 19% to 46% | 2026 current and expectation; 4,000 consumers | Survey and expectation |
Source for statistics 115 through 118: All figures come from Braze Customer Engagement Review 2026.
Brand-interaction agent use stands at 19%, while respondents expect 46% by year-end. That projection remains a stated expectation, not observed behavior.
Real-time personalization creates a large execution gap
Twilio surveyed 637 business leaders across eighteen countries. Its companion consumer sample included 7,640 people. Business claims and consumer expectations use different respondents. Statistics 119 through 121 preserve those parallel samples.
| # | Verified statistic | Key value | Period and denominator | Evidence type |
|---|---|---|---|---|
| 119 | Twilio found 96% said AI improved customer-facing operations, 56% used AI personalization, and 75% reported higher spending. | 96%; 56%; 75% | 2025 report; 637 business leaders across 18 countries | Business survey |
| 120 | Real-time personalization increased purchase likelihood for 88%, but only 44% of brands executed it; irrelevant experiences lost 71%. | 88%; 44%; 71% | 2025 report; 7,640 consumers and 637 business leaders | Parallel surveys |
| 121 | Consumers wanting personalization control reached 84%, AI disclosure 54%, and absolute data trust only 15%. | 84%; 54%; 15% | 2025 report; 7,640 consumers across 18 countries | Consumer survey |
Source for statistics 119 through 121: All figures come from Twilio State of Customer Engagement 2025.
Real-time personalization raises purchase likelihood for 88%, though only 44% of brands execute it. Irrelevant experiences push 71% toward abandonment. Brand capability still trails customer expectations substantially.
Consumers also want meaningful control over personalization. Eighty-four percent request control, while 54% want disclosure. Only 15% absolutely trust brands with personal data. Automated convenience cannot replace transparent data practices.
India exceeds global AI adoption within Salesforce’s sample
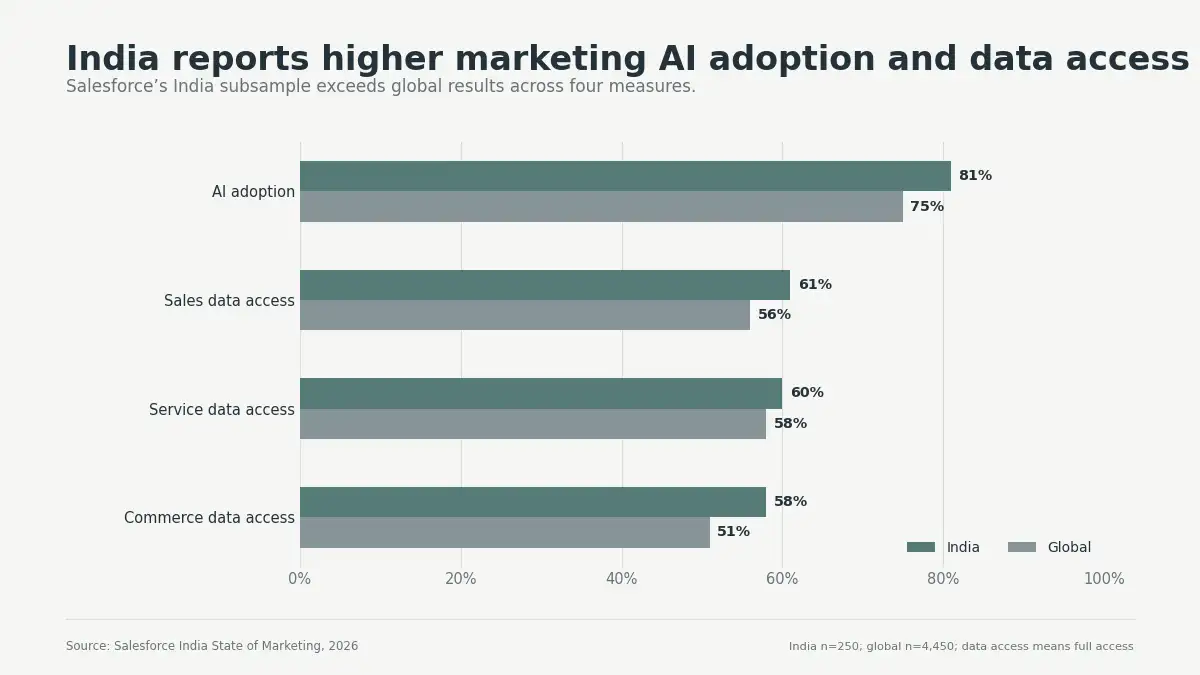
Salesforce’s India analysis includes 250 marketing decision-makers. Their adoption reaches 81%, compared with 75% globally. This comparison uses one survey and consistent definitions. It does not represent every Indian business.
| # | Verified statistic | Key value | Period and denominator | Evidence type |
|---|---|---|---|---|
| 122 | AI adoption among Indian marketers reached 81%, compared with 75% globally. | 81% India; 75% global | 2026 report; 250 Indian respondents within 4,450 global marketers | Survey comparison |
| 123 | India marketers reported two-way expectations at 92%, response struggles at 71%, and trust in AI replies at 86%. | 92%; 71%; 86% | 2026 report; 250 Indian marketing decision-makers | Survey estimates |
| 124 | Indian marketers had full access to service data 60%, sales data 61%, and commerce data 58%; 98% hit personalization barriers. | 60%; 61%; 58%; 98% | 2026 report; 250 Indian marketing decision-makers | Survey estimates |
| 125 | Unified-data teams were 1.4 times likelier to respond and 1.6 times likelier to use agents; 91% reshaped SEO and 92% optimized AI answers. | 1.4x; 1.6x; 91%; 92% | 2026 report; 250 Indian marketing decision-makers | Survey associations |
Source for statistics 122 through 125: All figures come from Salesforce India State of Marketing 2026.
Indian marketers face strong conversational pressure from customers. Ninety-two percent expect two-way exchanges, while 71% struggle responding promptly. Despite that gap, 86% trust AI to handle customer replies.
Full data access reaches 61% for sales, 60% for service, and 58% for commerce. Almost every AI marketer still reports personalization barriers. Unified data correlates with stronger responses and agent use.
Image suggestion: Compare Indian and global adoption with data-access measures.
SEO alt text: India marketing AI adoption exceeds the Salesforce global average.
Image slug: india-global-marketing-ai-adoption-2026
A practical program starts with measurable, high-intent workflows
A reliable automation program starts with visible customer intent. It then adds shared data, measurement, ownership, and controls. Teams should automate a few measurable journeys first. Broader orchestration can follow proven incremental results.
Start with workflows where timing changes customer value
High-intent workflows provide clearer entry rules and measurable outcomes. They also reduce dependence on broad audience assumptions. Start with two to four customer journeys. Assign one accountable owner to each journey.
Useful starting workflows include these common operating needs:
- Welcome and onboard new customers using declared preferences.
- Recover browsing or carts after clear behavioral intent.
- Score and nurture leads using documented qualification rules.
- Educate customers after purchase and reduce avoidable returns.
- Remind customers before renewals or replenishment windows.
- Reactivate inactive customers using conservative contact limits.
- Route qualified accounts toward sales with complete context.
- Manage consent, preferences, suppression, and message fatigue.
Avoid automating unstable processes without fixing them first. Automation can spread flawed rules faster across channels. Document current exceptions before choosing an automated path. Keep human escalation available for uncertain cases.
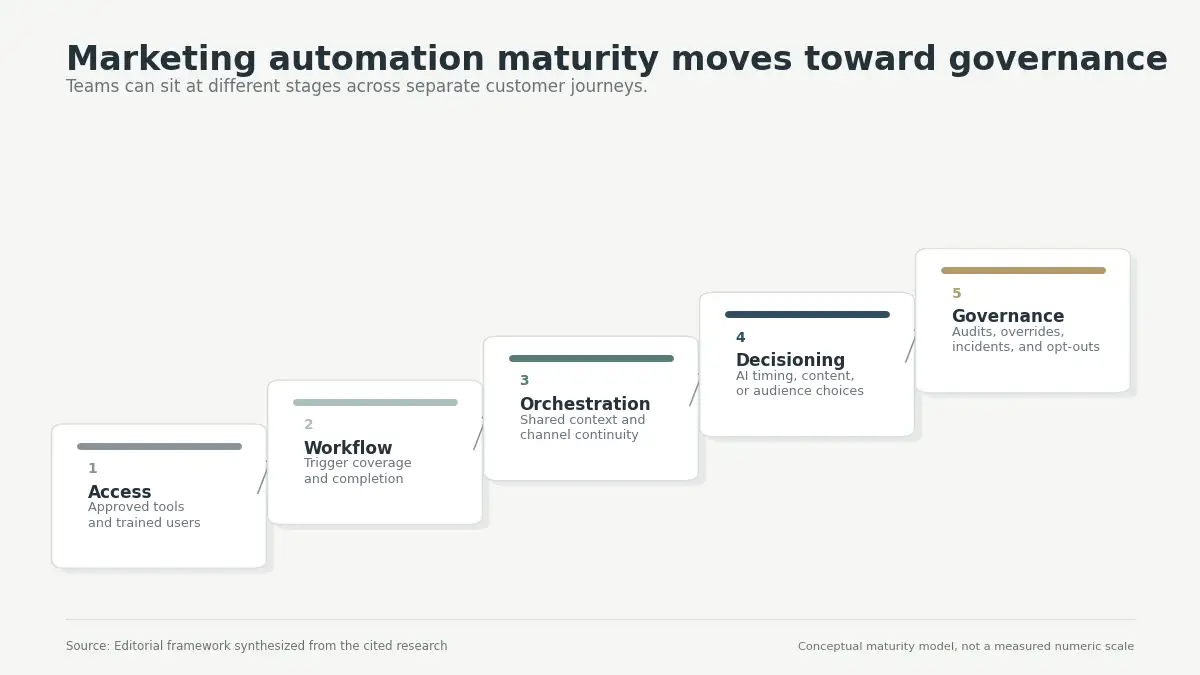
Use five stages for measuring automation maturity
Maturity should describe capabilities, not purchased software. Teams can reach different stages across journeys, while platform labels hide differences. Each stage answers a different management question.
| Stage | Management question | Practical measurement |
|---|---|---|
| Access | Can approved users reach suitable tools? | Licensed, active, and trained users |
| Workflow | Which defined journeys run automatically? | Trigger coverage, completion, failures, and overrides |
| Orchestration | Do channels share context and preferences? | Cross-channel continuity, duplication, and latency |
| Decisioning | Does AI select timing, content, or audiences? | Incremental lift, error rates, and override rates |
| Governance | Can teams explain and reverse decisions? | Audit coverage, incidents, opt-outs, and review findings |
Define success before building each workflow
Every workflow needs one primary commercial or service outcome. It also needs quality, risk, and fatigue measures. Baselines should cover several comparable historical periods. Seasonal businesses need matching seasonal comparisons.
A useful workflow scorecard includes these measures:
- Reach: eligible customers entering each documented journey.
- Execution: successful triggers, delays, failures, and duplicate messages.
- Engagement: qualified clicks, replies, and meaningful completed actions.
- Value: incremental profit, retention, service savings, or reduced returns.
- Quality: complaints, corrections, refunds, and human-review failures.
- Fatigue: unsubscribes, opt-outs, suppressions, and frequency-cap breaches.
- Fairness: outcome differences across relevant customer groups.
- Control: overrides, escalations, incidents, and reversal times.
Do not optimize every metric simultaneously. Choose one primary outcome and several safeguards. A conversion lift may hide increased returns. Lower service time may hide unresolved customer problems.
Run holdouts before scaling successful workflows
Randomized holdouts provide the strongest practical counterfactual. Keep treatment and holdout eligibility rules identical. Change only the automation treatment whenever possible. Record planned exclusions before reviewing final performance.
Use matched cohorts when random assignment remains impractical. Match on prior purchases, engagement, geography, and season. Document remaining differences and avoid causal certainty. Repeat tests after major platform or policy changes.
Govern AI decisions according to customer risk
Deterministic rules suit consent, eligibility, and regulated claims. AI can support discovery and optimization, though high-impact changes need review. Sensitive segments deserve stricter human approval and reversible actions.
Maintain an inventory covering models, prompts, data, and owners. Record which systems can send messages or change budgets. Audit logs should show inputs, outputs, and overrides. Incident plans should include rapid suspension procedures.
Review every workflow at least quarterly
Quarterly reviews catch drift, though regulated workflows may need monthly checks. Review customer-level performance because channel reports can hide duplicate pressure.
Retire workflows that no longer create incremental value. Pause journeys after major product or policy changes. Update content when inventory, pricing, or eligibility changes. Keep a dated revision record for every workflow.
Marketing automation answers depend on the denominator
No single percentage covers every company, workflow, tool, or channel. Each answer keeps its sample, date, and evidence type visible.
What percentage of companies use marketing automation in 2026?
No representative universal percentage exists for every company. MarTech found automation in 76.9% of stacks reported by 169 respondents, while HubSpot found 40% of journeys mostly or fully automated. Use the figure matching your question.
Sources: MarTech State of Your Stack and HubSpot journey research.
What is marketing automation’s average return on investment?
No current universal ROI average applies across businesses. Nucleus reported $5.44 per dollar in 2021 using 16 case studies published from 2016 through 2020. Current teams should measure incremental gross profit against total automation costs.
How much marketing work does AI perform?
US marketing leaders said AI performs 24.17% of marketing activities. They projected 55.91% within three years, but that second figure is a forecast rather than completed automation.
Source: The CMO Survey 2026.
Are AI agents widely used in marketing?
Agent use remains early despite broad AI adoption. Salesforce found 75% using some AI, while only 13% used agentic AI. Adobe separately found 13% organization-wide agent use for brand discovery.
Sources: Salesforce Tenth State of Marketing and Adobe AI and Digital Trends 2026.
Which automated marketing channel performs best?
No channel performs best across every business and objective. Triggered email and SMS show strong ecommerce results, though high-intent audiences explain part of the lift. Compare incremental profit using consistent holdouts.
Sources: Klaviyo Email Benchmarks and Klaviyo SMS Benchmarks.
Why do automated emails outperform scheduled campaigns?
Automated emails follow recent customer actions or lifecycle moments. Klaviyo reported 5.58% flow clicks versus 1.69% for campaigns, while placed-order rates were 2.11% versus 0.16%. Those platform comparisons do not prove automation caused the full difference.
Source: Klaviyo Email Benchmarks 2026.
What blocks marketing automation from scaling?
Data integration, budgets, expertise, and orchestration block many programs. The CMO Survey ranked budget and integration as the leading martech barriers, while Gartner found 70% saying internal processes lacked maturity.
Sources: The CMO Survey 2026 and Gartner CMO Spend Survey.
How should teams calculate incremental automation ROI?
Compare automated outcomes against a randomized holdout whenever possible. Calculate incremental ROI as incremental gross profit minus total automation cost, divided by total automation cost. Include software, labor, data, content, training, services, and governance.
Incremental ROI = (incremental gross profit − total automation cost) ÷ total automation cost
Use matched cohorts when random assignment remains impractical. Keep eligibility rules and measurement windows consistent across both groups.
Methodology keeps surveys, forecasts, and platform data separate
This article includes original research and direct company disclosures. It excludes secondary statistics blogs as evidence. Every numbered table includes direct source links. Verification occurred on August 11, 2026.
Evidence labels carry different editorial meanings:
| Evidence type | What it can support | Main limitation |
|---|---|---|
| Survey estimate | Reported behaviors, perceptions, outcomes, or expectations | Sampling, recall, wording, and response bias |
| Platform benchmark | Observed activity within one vendor’s customer base | Customer mix, attribution rules, and selection effects |
| Company disclosure | Internal product performance or operating changes | Limited independent auditing and chosen comparison groups |
| Analyst forecast | Defined market estimates and modeled future growth | Market boundaries, assumptions, and forecast uncertainty |
| Community survey | Directional stack and operations patterns | Small convenience samples and specialist audiences |
| Case-study synthesis | Detailed outcomes across documented customers | Selection, survivorship, and limited generalizability |
Survey findings are not population facts, while platform revenue is not incremental. Forecasts remain separate from measured historical outcomes. Vendor tests remain labeled as internal benchmarks.
Several popular statistics need correction or retirement
Many articles repeat older figures under current headlines. The original year and method should remain visible. Unsupported claims should not receive refreshed dates. Current primary evidence usually offers safer replacements.
| Repeated claim | Evidence problem | Safer editorial treatment |
|---|---|---|
| Automation returns $5.44 during 2026 | Published during 2021 from sixteen older cases | Keep the 2021 date and case-study scope |
| Automation raises sales productivity by 14.5% | Original Nucleus note dates from 2012 | Prefer CMO Survey’s current 14.06% finding |
| Automation cuts marketing overhead by 12.2% | Original Nucleus note dates from 2012 | Prefer CMO Survey’s current 14.64% finding |
| Automation creates 451% more qualified leads | Public methodology remains weak or unavailable | Omit any universal current benchmark |
| Seventy-six percent of companies use automation | Current 76.9% uses 169 community respondents | Name that sample and avoid all-company wording |
| Seventy-nine percent of journeys are automated | Current sources use different maturity categories | Use HubSpot’s 40% mostly or fully automated |
| Automated emails create 320% more revenue | Widely repeated older campaign research | Prefer current Klaviyo and Omnisend benchmarks |
| Ninety-two percent use AI automation | Conflates AI usage with workflow automation | Use source-specific definitions and denominators |
| The market has one universal 2026 value | Research firms define different market boundaries | Use one named forecast without averaging |
Final verdict favors measured orchestration over more automation
Marketing automation is common, while connected journeys remain less mature. AI accelerates decisions, content, bidding, and conversations. Data access and governance determine whether those gains persist.
Automate high-intent workflows before broad campaign volume. Measure incremental profit instead of platform-attributed revenue. Keep consent, fatigue, and quality beside conversion metrics. Expand only after results survive credible holdout testing.