
100 Cloudflare Statistics 2026: Revenue, Users, Outage History
Financial and security figures are labeled by reporting period. Website-usage figures are independent estimates and should not be confused with Cloudflare's internal traffic telemetry.
Cloudflare has grown from a content delivery network and DNS provider into a broad connectivity-cloud platform serving security, performance, developer, Zero Trust, AI, and networking workloads.
The company’s latest financial results show that Cloudflare generated $696.1 million in revenue in Q2 2026, up 36% year over year. Its global network spans 337 cities, connects to more than 13,000 networks, and reaches approximately 95% of the world’s Internet-connected population within 50 milliseconds.
Cloudflare’s security data also shows how quickly the threat landscape is expanding. The company reported 47.1 million DDoS attacks during 2025, while its H1 2026 DDoS report recorded 23.2 million network-layer attacks and 29.64 trillion HTTP DDoS requests in just six months.
In this article, I’ve compiled 100 current Cloudflare statistics covering its revenue, customers, network, market share, DDoS protection, developers, AI, and Internet infrastructure.
Note: Financial and security figures are labeled by reporting period. Website-usage figures are independent estimates and should not be confused with Cloudflare's internal traffic telemetry.
Cloudflare Statistics 2026 (Top Picks)
- Cloudflare generated $696.1 million in Q2 2026 revenue, up 36% year over year.
- Cloudflare reported $2.1679 billion in FY2025 revenue, up approximately 29.8% year over year.
- Cloudflare’s FY2026 revenue guidance is $2.864 billion to $2.870 billion.
- Cloudflare’s network spans 337 cities across eight regions.
- The network connects to more than 13,000 networks.
- Approximately 95% of the world’s Internet-connected population is within 50 milliseconds of a Cloudflare data center.
- Cloudflare’s public pages report blocking approximately 209 billion to more than 234 billion cyber threats daily, depending on the page and reporting scope.
- Cloudflare mitigated 47.1 million DDoS attacks in 2025, a 121% increase from the previous year.
- The largest publicly reported attack in the 2025 reporting cycle peaked at 31.4 Tbps and lasted approximately 35 seconds.
- Cloudflare mitigated 23.2 million network-layer DDoS attacks during H1 2026.
- Cloudflare mitigated 29.64 trillion HTTP DDoS requests during H1 2026.
- W3Techs reported Cloudflare on 17.7% of all websites in its August 8, 2026 DNS-provider comparison.
- Cloudflare’s Q2 2026 large-customer cohort reached approximately 4,698 customers paying more than $100,000 annually.
- Large customers contributed approximately 73% of revenue in the latest investor-relations data.
- Cloudflare has historically reported more than one million developers building applications with its platform.
100 Cloudflare Statistics At A Glance
| No. | Statistic | Figure |
|---|---|---|
| 1 | Q2 2026 revenue | $696.1 million |
| 2 | Q2 2026 revenue growth | 36% YoY |
| 3 | Q1 2026 revenue | $639.8 million |
| 4 | Q1 2026 revenue growth | 34% YoY |
| 5 | FY2025 revenue | $2.1679 billion |
| 6 | FY2025 revenue growth | 29.8% YoY |
| 7 | Q4 2025 revenue | $614.5 million |
| 8 | Q4 2025 revenue growth | 34% YoY |
| 9 | Q2 2026 GAAP operating loss | $205.7 million |
| 10 | Q2 2026 GAAP operating-loss margin | 29.6% |
| 11 | Q2 2026 non-GAAP operating income | $96.1 million |
| 12 | Q2 2026 non-GAAP operating margin | 13.8% |
| 13 | Q1 2026 GAAP operating loss | $62.0 million |
| 14 | Q1 2026 non-GAAP operating income | $73.1 million |
| 15 | Q2 2026 operating cash flow | $117.6 million |
| 16 | Q2 2026 free cash flow | $56.4 million |
| 17 | Q2 2026 free-cash-flow margin | 8% |
| 18 | Q1 2026 operating cash flow | $158.3 million |
| 19 | Q1 2026 free cash flow | $84.1 million |
| 20 | Q1 2026 free-cash-flow margin | 13% |
| 21 | Q3 2026 revenue guidance | $736 million–$737 million |
| 22 | FY2026 revenue guidance | $2.864 billion–$2.870 billion |
| 23 | FY2026 non-GAAP operating-income guidance | $443 million–$445 million |
| 24 | FY2026 non-GAAP EPS guidance | $1.25–$1.26 |
| 25 | Q2 2026 current RPO growth | 35% YoY |
| 26 | Q2 2026 large customers | 4,698 |
| 27 | Large-customer revenue contribution | 73% |
| 28 | Q1 2026 large customers | 4,416 |
| 29 | Q1 2025 large customers | 3,527 |
| 30 | Q1 large-customer growth | Approximately 25.2% YoY |
| 31 | FY2025 paying customers | Approximately 332,466; verify against latest filing |
| 32 | FY2025 large customers | Approximately 4,298 |
| 33 | Q4 2025 largest annual contract value | Approximately $42.5 million per year |
| 34 | Q4 2025 new ACV growth | Nearly 50% YoY |
| 35 | Q1 2026 direct-customer revenue | $446.8 million |
| 36 | Q1 2026 channel-partner revenue | $193.0 million |
| 37 | Direct-customer revenue share | Approximately 70% |
| 38 | Channel-partner revenue share | Approximately 30% |
| 39 | Network cities | 337 |
| 40 | Network regions | 8 |
| 41 | Countries covered | More than 100; some pages state 125 |
| 42 | Mainland China locations | 30 cities on the network-services page |
| 43 | Network interconnections | More than 13,000 |
| 44 | Documented network capacity | More than 405 Tbps |
| 45 | Alternate DDoS-report capacity figure | Approximately 500 Tbps |
| 46 | Population within 50 ms | Approximately 95% |
| 47 | Most users within | 20 ms, according to Cloudflare’s network page |
| 48 | Average HTTP requests per second | More than 57 million |
| 49 | Peak HTTP requests per second | More than 77 million |
| 50 | Daily threats blocked | Approximately 209 billion in architecture documentation |
| 51 | Alternate daily-threat figure | More than 234 billion |
| 52 | Web properties protected | More than 20% of Internet web properties |
| 53 | W3Techs overall website usage | 17.7% |
| 54 | Top-1-million website usage | 35.5% |
| 55 | Top-100,000 website usage | 42.3% |
| 56 | Top-10,000 website usage | 42.8% |
| 57 | Top-1,000 website usage | 44.3% |
| 58 | Cloudflare traffic visibility | Approximately 20% of global Internet traffic |
| 59 | Global Cloudflare traffic growth in 2025 | 19% |
| 60 | Cloudflare traffic mitigated in 2025 | 6.2% |
| 61 | Traffic mitigated as DDoS or managed rules | 3.3% |
| 62 | DDoS attacks in 2025 | 47.1 million |
| 63 | DDoS year-over-year increase | 121% |
| 64 | Average DDoS attacks per hour in 2025 | 5,376 |
| 65 | Approximate average DDoS attacks per day | 129,000 |
| 66 | Network-layer attacks in 2025 | 34.4 million |
| 67 | Network-layer attacks in 2024 | 11.4 million |
| 68 | Q1 2025 DDoS attacks | 20.5 million |
| 69 | Q1 2025 DDoS YoY increase | 358% |
| 70 | Q1 2025 network-layer attacks | 16.8 million |
| 71 | Q1 2025 network-layer YoY increase | 509% |
| 72 | Q1 2025 HTTP DDoS YoY increase | 118% |
| 73 | Q2 2025 DDoS attacks | 7.3 million |
| 74 | Q2 2025 hyper-volumetric attacks | More than 6,500 |
| 75 | Q3 2025 DDoS attacks | 8.3 million |
| 76 | Q3 2025 average attacks per hour | Approximately 3,780 |
| 77 | Q4 2025 network-layer growth | 31% QoQ and 58% YoY |
| 78 | Largest reported attack | 31.4 Tbps |
| 79 | Duration of 31.4 Tbps attack | Approximately 35 seconds |
| 80 | Q1 2025 packet-rate record | 4.8 billion packets per second |
| 81 | Q1 2025 bandwidth record | 6.5 Tbps |
| 82 | H1 2026 network-layer mitigations | 23.2 million |
| 83 | H1 2026 HTTP DDoS requests mitigated | 29.64 trillion |
| 84 | H1 2026 attacks above 1 Tbps | 935 |
| 85 | H1 2026 DNS-flood share | 34.3% of network-layer activity |
| 86 | Historical developer adoption | More than one million developers |
| 87 | Public DNS resolver | 1.1.1.1 |
| 88 | Cloudflare platform category | Connectivity cloud |
| 89 | Data localization controls | Traffic inspection, key storage, and log-retention controls |
| 90 | Network operating model | Anycast network |
| 91 | Q2 2026 non-GAAP operating margin | 13.8% |
| 92 | Q2 2026 free-cash-flow margin | 8% |
| 93 | Q2 2026 large-customer threshold | More than $100,000 annualized revenue |
| 94 | Q1 2026 direct-revenue percentage | Approximately 70% |
| 95 | Q1 2026 channel-revenue percentage | Approximately 30% |
| 96 | FY2026 operating-income guidance midpoint | Approximately $444 million |
| 97 | FY2026 revenue-guidance midpoint | Approximately $2.867 billion |
| 98 | Approximate daily DDoS rate in 2025 | 5,376 × 24 = 129,024 |
| 99 | Q1 2026 large-customer increase | 889 customers versus Q1 2025 |
| 100 | Q2 2026 quarterly-revenue increase versus Q1 | Approximately $56.3 million |
Sources: Cloudflare Q2 2026 financial results, Cloudflare FY2025 results, Cloudflare Global Network, Cloudflare security architecture, W3Techs, and Cloudflare Radar DDoS reports.
Cloudflare Revenue Statistics
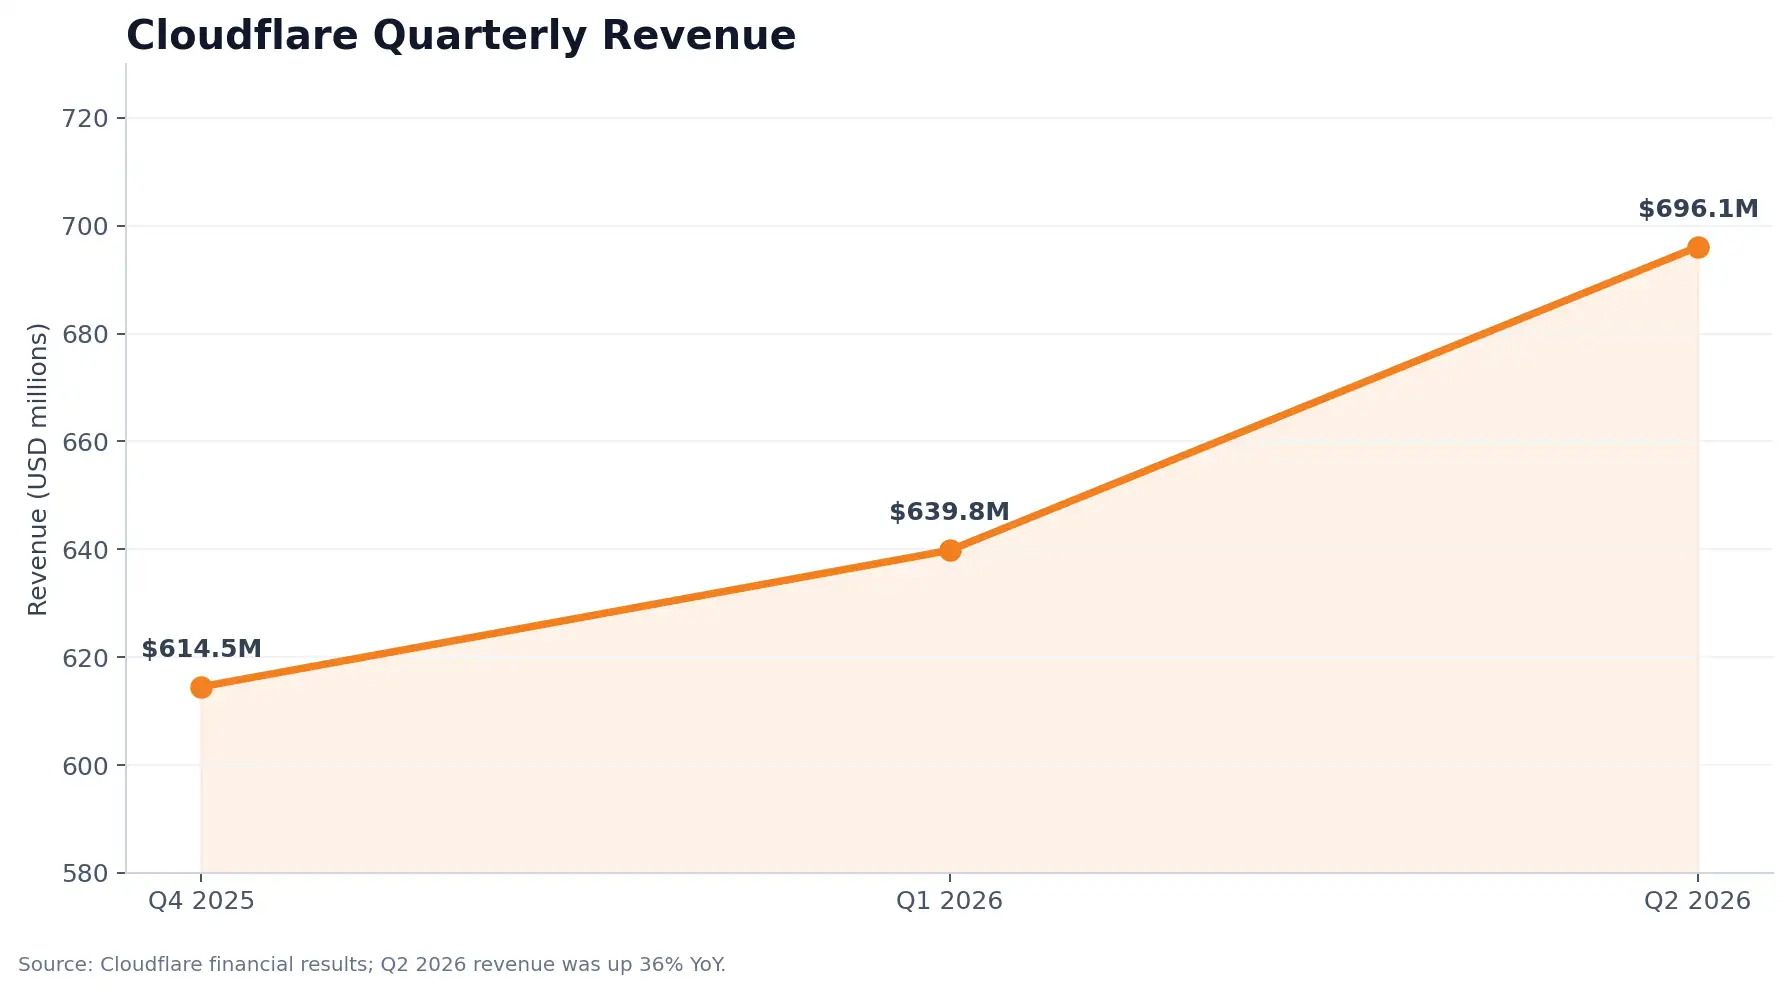
Cloudflare generated $696.1 million in revenue in Q2 2026, representing a 36% year-over-year increase. This was higher than the $639.8 million recorded in Q1 2026.
Cloudflare quarterly revenue
| Quarter | Revenue | YoY growth |
|---|---|---|
| Q4 2025 | $614.5 million | 34% |
| Q1 2026 | $639.8 million | 34% |
| Q2 2026 | $696.1 million | 36% |
Cloudflare’s revenue growth accelerated by approximately 2 percentage points between Q1 and Q2 2026.
Cloudflare annual revenue
| Fiscal year | Revenue | YoY growth |
|---|---|---|
| 2025 | $2.1679 billion | 29.8% |
| 2024 | Approximately $1.67 billion | — |
| 2023 | Approximately $1.30 billion | — |
| 2022 | Approximately $975.2 million | — |
| 2021 | Approximately $656.4 million | — |
| 2020 | Approximately $431.1 million | — |
Cloudflare’s revenue has grown rapidly since 2020 as customers adopted its application security, Zero Trust, developer, and network services.
Source: Cloudflare investor relations.
Cloudflare 2026 revenue guidance
For fiscal 2026, Cloudflare expects:
- Revenue of $2.864 billion to $2.870 billion.
- Non-GAAP operating income of $443 million to $445 million.
- Non-GAAP diluted earnings per share of $1.25 to $1.26.
For Q3 2026, the company expects revenue of $736 million to $737 million.
Source: Cloudflare Q2 2026 financial results.
Cloudflare Profit and Cash Flow Statistics
Cloudflare reported a Q2 2026 GAAP operating loss of $205.7 million, compared with non-GAAP operating income of $96.1 million.
| Metric | Q2 2026 | Q1 2026 |
|---|---|---|
| GAAP operating income/loss | $(205.7) million | $(62.0) million |
| Non-GAAP operating income | $96.1 million | $73.1 million |
| Operating cash flow | $117.6 million | $158.3 million |
| Free cash flow | $56.4 million | $84.1 million |
| Free-cash-flow margin | 8% | 13% |
Revenue growth and cash flow should be evaluated separately. Cloudflare’s Q2 free cash flow increased year over year, but its quarterly free-cash-flow margin was lower than in Q1 2026.
Cloudflare Customer Statistics
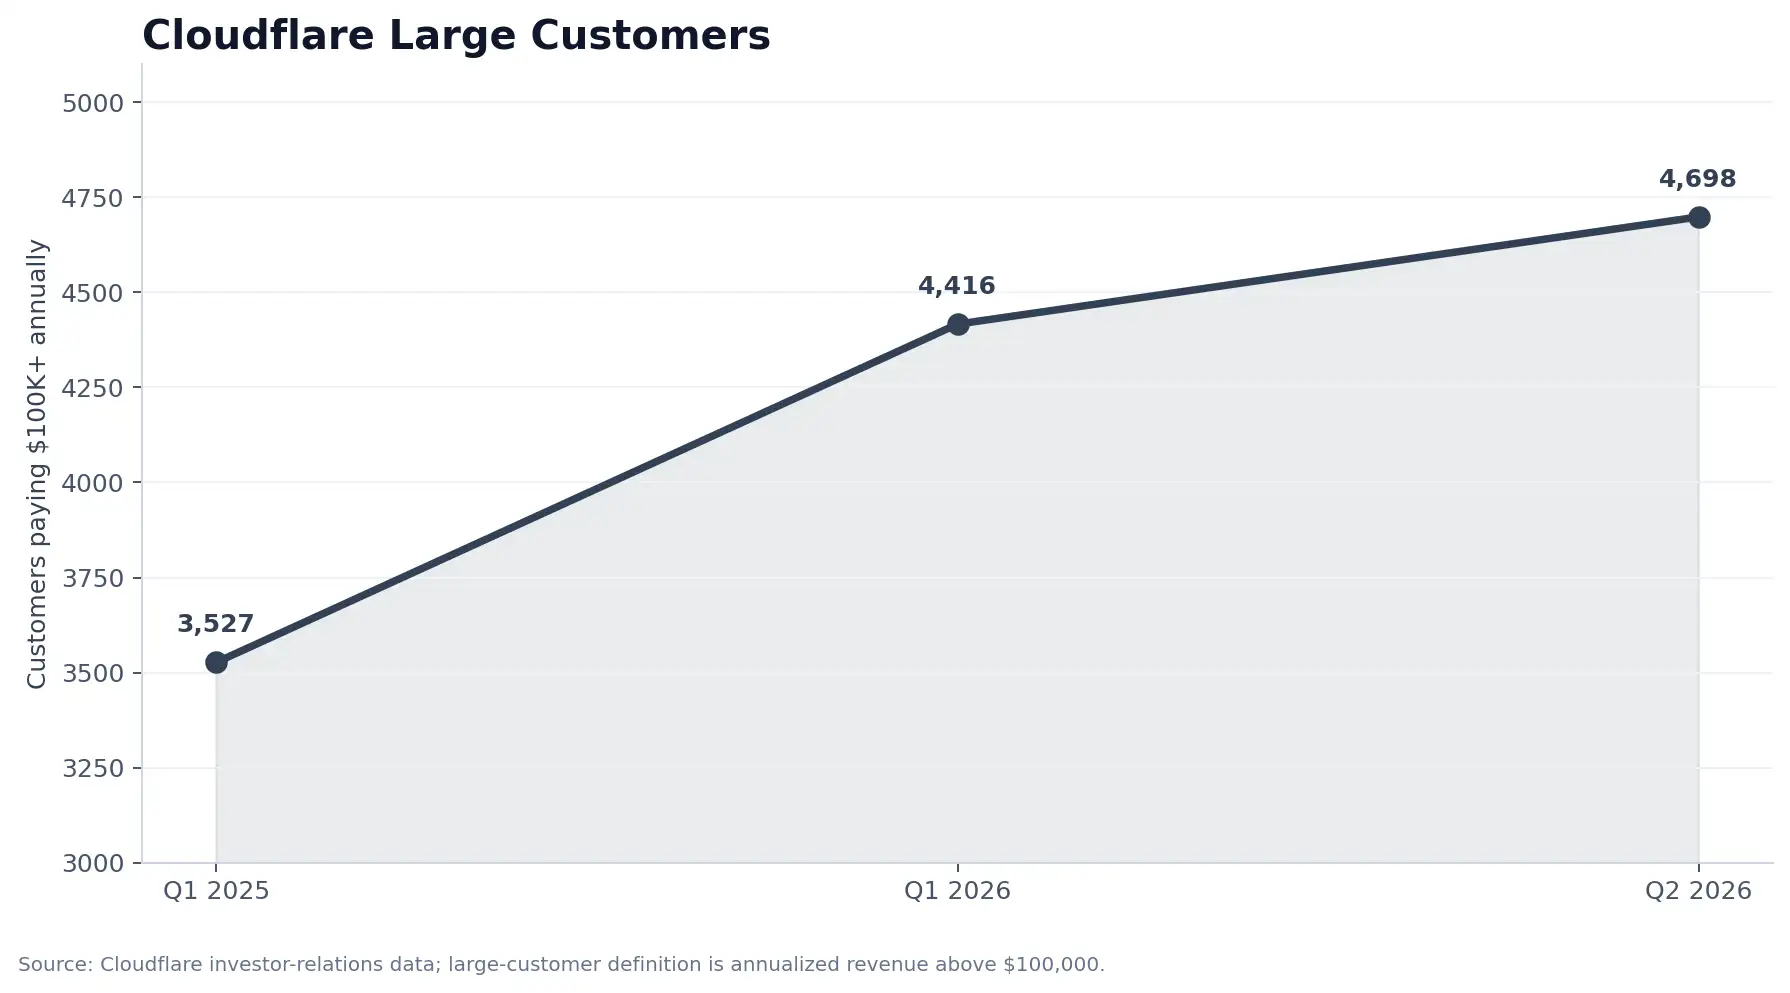
Cloudflare’s latest investor-relations data reported approximately 4,698 customers paying more than $100,000 annually. These large customers contributed approximately 73% of revenue.
Cloudflare large-customer growth
| Period | Customers with more than $100,000 in annualized revenue |
|---|---|
| Q1 2025 | 3,527 |
| Q1 2026 | 4,416 |
| Q2 2026 | 4,698 |
From Q1 2025 to Q1 2026, the number of large customers increased by approximately 889, or 25.2%.
Direct customers and channel partners
In Q1 2026, direct customers generated approximately $446.8 million, while channel partners generated approximately $193.0 million.
| Customer route | Q1 2026 revenue | Share of revenue |
|---|---|---|
| Direct customers | $446.8 million | Approximately 70% |
| Channel partners | $193.0 million | Approximately 30% |
Source: Cloudflare Q1 2026 filing summary.
Note: Cloudflare’s total paying-customer count should be taken from the most recent official filing before publication. Third-party pages currently publish conflicting totals, so they should not be treated as equivalent.
Cloudflare Network Statistics
Cloudflare’s network spans 337 cities across eight regions and connects to more than 13,000 networks.
Cloudflare network footprint
| Network metric | Figure |
|---|---|
| Cities | 337 |
| Regions | 8 |
| Countries | More than 100; some pages state 125 |
| Network interconnections | More than 13,000 |
| Population within 50 ms | Approximately 95% |
| Documented capacity | More than 405 Tbps |
| Alternate public capacity figure | Approximately 500 Tbps |
Cloudflare says that most users are within 20 milliseconds of a data center. It also states that traffic is inspected once at the nearest data center rather than being passed through separate security layers.
Cloudflare request-processing scale
Cloudflare’s security-architecture documentation says its network processes more than 57 million HTTP requests per second on average and more than 77 million HTTP requests per second at peak.
The same documentation describes an average of approximately 209 billion cyber threats detected or blocked daily. Cloudflare’s public network page separately reports more than 234 billion daily cyber threats. The article should keep both figures labeled by source rather than merging them.
Sources: Cloudflare network page and Cloudflare security architecture.
Cloudflare Website Usage and Market Share
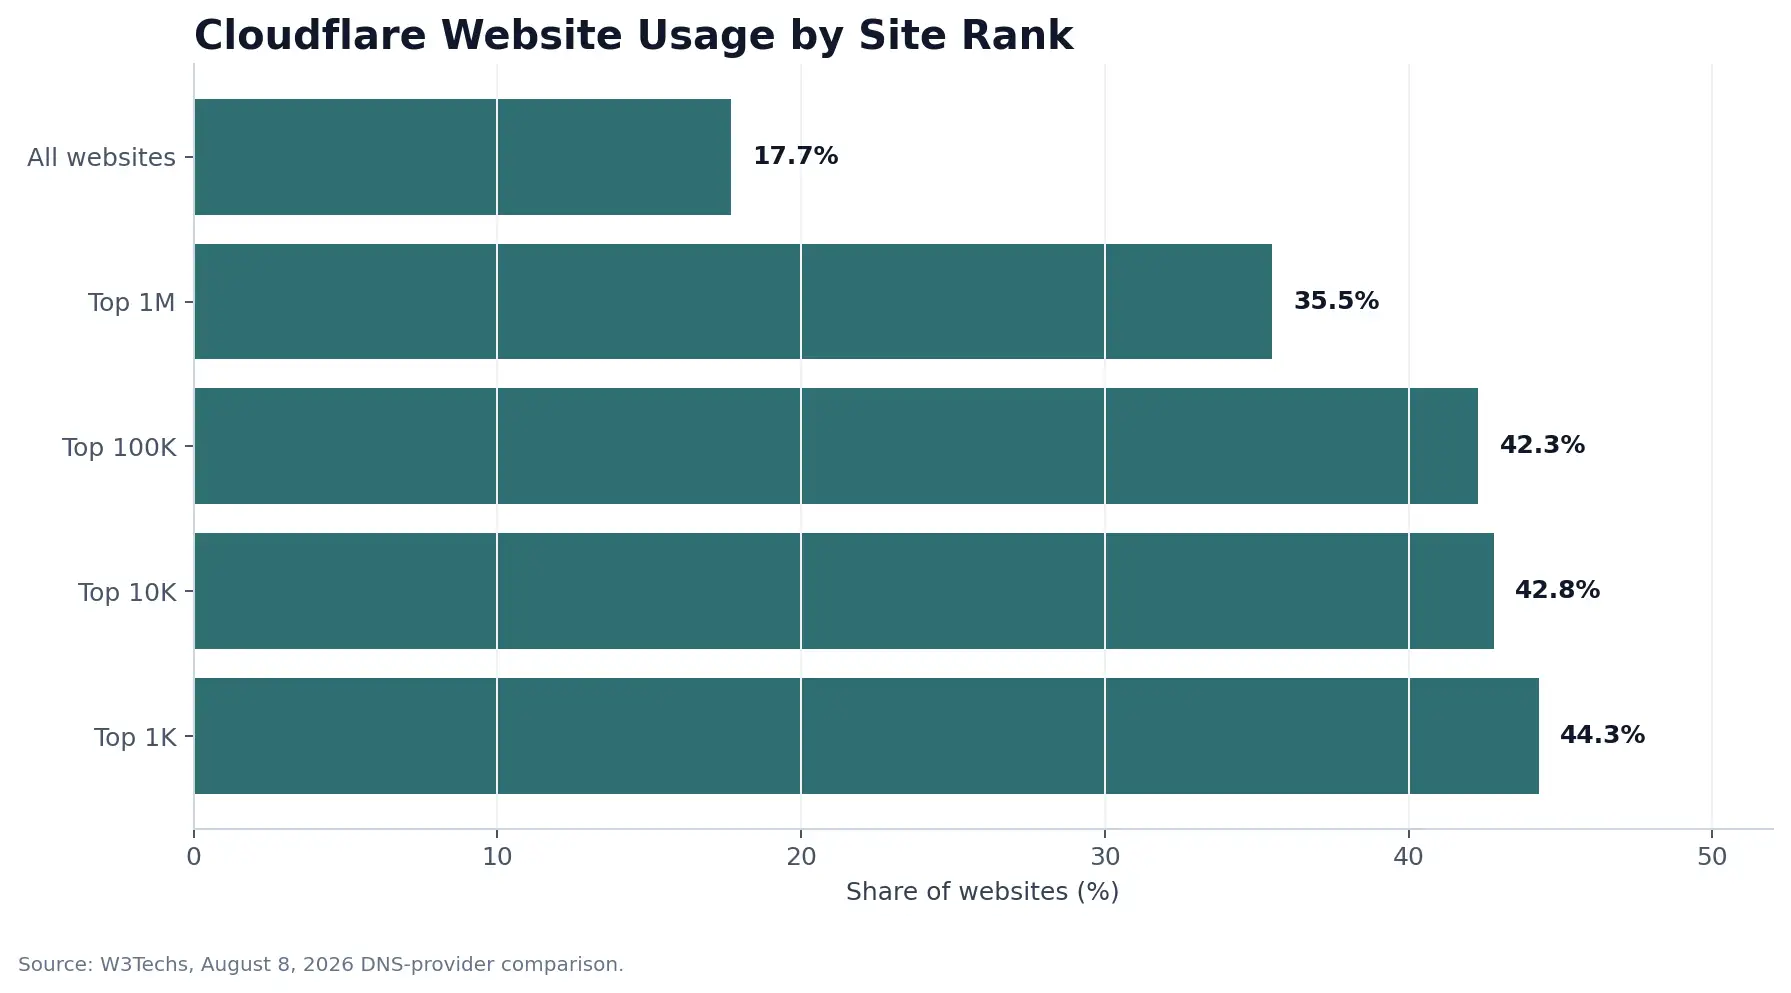
W3Techs reported that Cloudflare was used by 17.7% of all websites in its August 8, 2026 DNS-provider comparison.
Cloudflare usage by website ranking
| Website group | Cloudflare usage |
|---|---|
| All websites | 17.7% |
| Top 1 million | 35.5% |
| Top 100,000 | 42.3% |
| Top 10,000 | 42.8% |
| Top 1,000 | 44.3% |
This shows that Cloudflare adoption is considerably higher among popular websites than across the entire web.
Source: W3Techs Cloudflare usage statistics.
Why Cloudflare market-share figures vary
Competitors often cite Cloudflare at 20%, 21%, 23%, or another percentage. These figures can differ because providers measure different categories, including:
- DNS-provider usage
- CDN usage
- Reverse-proxy usage
- Active websites
- All detected websites
- Ranked websites
- Websites with an identifiable technology signature
Cloudflare’s statement that it has visibility into approximately 20% of global Internet traffic is also different from saying that Cloudflare is installed on 20% of websites.
Cloudflare Radar Statistics
Cloudflare Radar’s 2025 Year in Review reported that global traffic over Cloudflare’s network increased by 19% in 2025.
It also reported that 6.2% of global traffic over Cloudflare’s network was mitigated by Cloudflare systems, either because it was potentially malicious or because of customer-defined rules. Approximately 3.3% was mitigated as DDoS traffic or through managed rules.
Cloudflare traffic categories
| Cloudflare Radar metric | 2025 figure |
|---|---|
| Global traffic growth over Cloudflare’s network | 19% |
| Traffic mitigated by Cloudflare systems | 6.2% |
| Traffic mitigated as DDoS or managed rules | 3.3% |
Source: Cloudflare Radar 2025 Year in Review.
Cloudflare DDoS Statistics
Cloudflare reported 47.1 million DDoS attacks in 2025, a 121% increase from 2024. That equals an average of 5,376 attacks per hour.
DDoS attacks in 2025
| Metric | Figure |
|---|---|
| Total DDoS attacks | 47.1 million |
| Year-over-year increase | 121% |
| Average attacks per hour | 5,376 |
| Approximate attacks per day | 129,000 |
| Network-layer attacks | 34.4 million |
| Network-layer attacks in 2024 | 11.4 million |
The daily figure is calculated by multiplying 5,376 attacks per hour by 24 hours. It is an average, not a prediction of the number of attacks on a particular day.
Quarterly DDoS statistics
| Period | DDoS attacks | Additional insight |
|---|---|---|
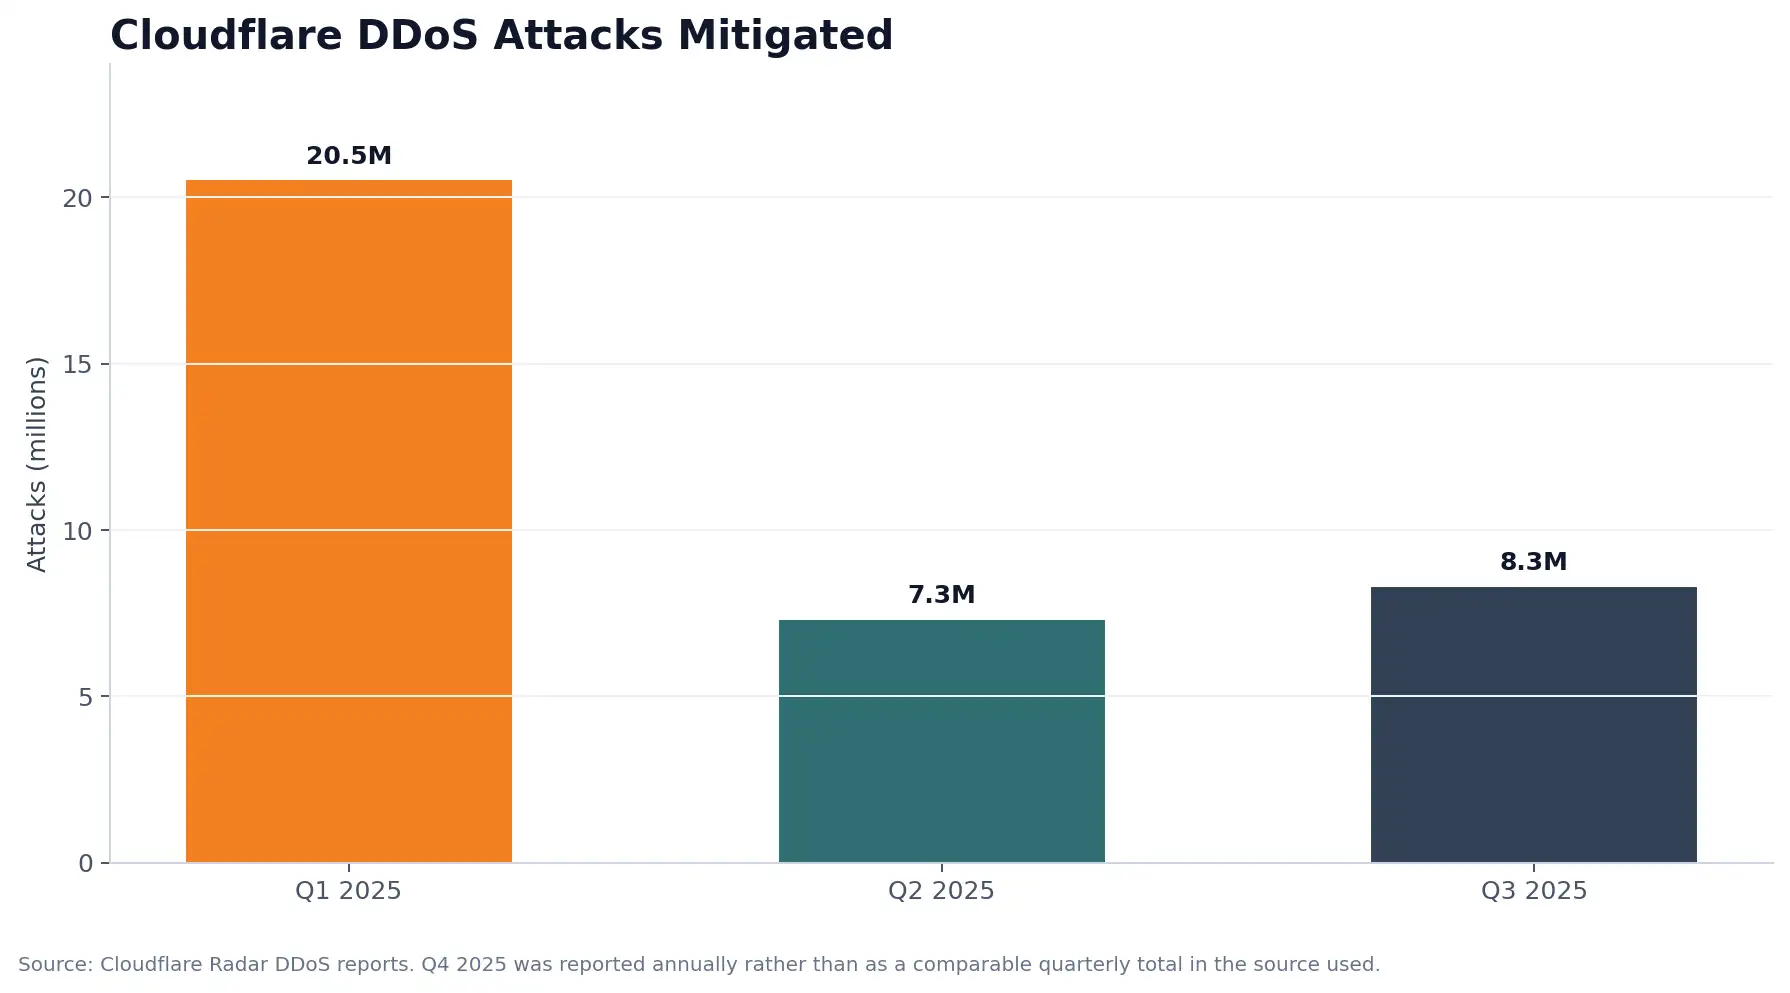
| Q1 2025 | 20.5 million | Up 358% YoY |
| Q2 2025 | 7.3 million | More than 6,500 hyper-volumetric attacks |
| Q3 2025 | 8.3 million | Approximately 3,780 attacks per hour |
| Q4 2025 | — | Network-layer attacks grew 31% QoQ |
| H1 2026 network layer | 23.2 million | 935 attacks exceeded 1 Tbps |
Sources: Cloudflare Q4 2025 DDoS report, Q1 2025 report, Q2 2025 report, Q3 2025 report, and H1 2026 report.
Largest DDoS attack statistics
Cloudflare reported that the largest attack in its 2025 reporting cycle peaked at 31.4 Tbps and lasted approximately 35 seconds.
Cloudflare also reported a Q1 2025 packet-rate record of 4.8 billion packets per second and a bandwidth record of 6.5 Tbps.
These were extreme events and should not be described as typical DDoS attacks. A useful article should show the records alongside average attack frequency and attack-layer data.
H1 2026 DDoS trends
Cloudflare’s H1 2026 report recorded:
- 23.2 million network-layer DDoS mitigations.
- 29.64 trillion HTTP DDoS requests mitigated.
- 935 network-layer attacks exceeding 1 Tbps.
- DNS-based attacks accounting for 34.3% of network-layer activity.
- A 519% quarter-over-quarter surge in attacks exceeding 1 Tbps between Q1 and Q2.
Cloudflare AI, Workers, and Developer Statistics
Cloudflare has historically reported that more than one million developers use its platform to build and maintain applications. This figure is useful as a platform-adoption milestone, but it should not automatically be presented as the current number of monthly active developers.
Cloudflare’s developer ecosystem includes:
- Workers
- Workers AI
- Durable Objects
- Workers KV
- Queues
- AI Gateway
- R2 object storage
- Hyperdrive
- Workers Logs
Cloudflare’s 2026 product and developer announcements increasingly frame the platform around AI workloads, agentic applications, and machine-to-machine traffic.
Developer statistic definitions
| Term | What it means |
|---|---|
| Registered developer | A developer account or platform registration |
| Active developer | A developer who performs a defined activity within a period |
| Workers deployment | A deployed serverless application or code workload |
| Request volume | Platform requests, not necessarily unique users |
| AI request | A request routed through an AI-related product or service |
This distinction prevents historical developer-adoption figures from being presented as current active-user data.
Cloudflare Product Statistics and Facts
Cloudflare’s product portfolio includes several major categories:
CDN and performance
Cloudflare’s CDN caches and delivers content from its global edge network. Its edge model is designed to reduce latency by processing requests closer to users.
DNS
Cloudflare offers authoritative DNS and the public 1.1.1.1 DNS resolver.
Application security
Cloudflare provides web application firewall services, DDoS protection, bot management, API security, rate limiting, and managed rules.
Zero Trust and SASE
Cloudflare’s Zero Trust portfolio includes Access, Gateway, Tunnel, Browser Isolation, and related identity and network-security products.
Developer infrastructure
Workers, Durable Objects, KV, Queues, R2, and Workers AI support serverless applications, storage, data, and AI workloads.
Cloudflare Outage and Reliability Statistics
Cloudflare operates critical Internet infrastructure across 337 cities, connects to more than 13,000 networks, and places approximately 95% of the Internet-connected population within 50 milliseconds of a Cloudflare data center.
However, network scale does not mean that every Cloudflare product is immune to outages. Cloudflare’s own postmortems show that incidents can affect the control plane, storage, regional routing, dashboard, API, or network traffic differently.
The most important reliability conclusion is that Cloudflare does not publish one universal, company-wide uptime percentage covering every product and customer. Availability must be evaluated by service, region, and incident type.
Cloudflare network and reliability indicators
| Reliability metric | Latest public figure |
|---|---|
| Network cities | 337 |
| Network regions | 8 |
| Network interconnections | 13,000+ |
| Population within 50 ms of a Cloudflare data center | Approximately 95% |
| Most users within | Approximately 20 ms, according to Cloudflare |
| Average HTTP request processing | 57M+ requests per second |
| Peak HTTP request processing | 77M+ requests per second |
| Documented network capacity | 405 Tbps+ |
| Alternate capacity figure in DDoS materials | Approximately 500 Tbps |
| Daily cyber threats blocked | 209B to 234B+, depending on source page |
| Universal company-wide uptime percentage | Not publicly disclosed |
Sources: Cloudflare Global Network and Cloudflare Security Architecture.
Major Cloudflare outages and incidents
Cloudflare outage on November 18, 2025
On November 18, 2025, Cloudflare’s network experienced significant failures delivering core network traffic.
- Impact began: 11:20 UTC
- Core traffic largely restored: 14:30 UTC
- Full restoration: 17:06 UTC
- Core impact duration: Approximately 3 hours and 10 minutes
- Full recovery period: Approximately 5 hours and 46 minutes
- Primary cause: A Bot Management feature-file generation failure caused by a database-permissions change
- Attack-related? No; Cloudflare stated that the incident was not caused by a cyberattack
Cloudflare later explained that the configuration file exceeded assumptions in the production proxy system and caused widespread failures. The incident affected core traffic and multiple products, although not every Cloudflare service was unavailable for the entire period.
Source: Cloudflare outage on November 18, 2025.
Cloudflare outage on December 5, 2025
Cloudflare experienced another significant traffic outage on December 5, 2025.
- Impact began: Approximately 08:47 UTC
- Duration: Approximately 25 minutes
- Traffic affected: Approximately 28% of applications or HTTP traffic behind Cloudflare, according to Cloudflare’s incident summaries
- Cause: Configuration changes made while attempting to mitigate an industry-wide React Server Components vulnerability
- Attack-related? No
The December incident followed the November outage by less than three weeks. Cloudflare subsequently launched its “Code Orange: Fail Small” resilience initiative to reduce the blast radius of future failures.
Sources: Cloudflare postmortem and resilience plan and Cloudflare Q4 2025 Internet disruptions.
Cloudflare service outage on June 12, 2025
On June 12, 2025, multiple Cloudflare services experienced an outage lasting up to 2 hours and 28 minutes.
Affected products included Workers KV, Cloudflare Access, WARP, Cloudflare Dashboard, and other services dependent on Workers KV.
Cloudflare reported that approximately 91% of Workers KV requests failed during the incident window. The failure of Workers KV produced a cascading effect because several Cloudflare products relied on it for storage or coordination.
Cloudflare later re-architected Workers KV’s storage backend to improve redundancy and remove single points of failure.
Sources: Cloudflare service outage on June 12, 2025 and Workers KV redesign.
Cloudflare R2 incident on March 21, 2025
Cloudflare’s R2 object-storage service experienced elevated errors for 1 hour and 7 minutes on March 21, 2025.
- Impact window: 21:38–22:45 UTC
- R2 write-operation failure rate: 100%
- R2 read-operation failure rate: Approximately 35% globally
- Images uploads: 100% failed during the primary window
- Stream uploads: 100% failed during the primary window
- Log-processing delay: Up to 70 minutes
- Data loss: Cloudflare stated that there was no data loss or risk to R2 storage integrity
- Root cause: A credential-rotation and deployment-environment error
Source: Cloudflare incident on March 21, 2025.
Cloudflare R2 incident on February 6, 2025
On February 6, 2025, R2 experienced a primary outage from 08:14 UTC to 09:13 UTC.
- Primary incident duration: 59 minutes
- R2 operations affected: 100% during the primary window
- Durable Objects error increase: 0.09% in North America during the secondary recovery period
- Cache Purge API error-rate increase: 1.8%
- Vectorize query failures: 75%
- Non-R2 Log Delivery data loss: Up to 4.5%
- R2 Log Delivery data loss: Up to 13.6%
- Data loss in R2 storage: None reported
- Root cause: R2 Gateway was inadvertently disabled while responding to an abuse report
Source: Cloudflare incident on February 6, 2025.
Cloudflare Dashboard and API outage on September 12, 2025
Cloudflare’s Dashboard and related APIs were unavailable or partially available for approximately 1 hour on September 12, 2025.
- Impact began: 17:57 UTC
- Impact ended: 19:12 UTC
- Approximate duration: 1 hour and 15 minutes
- Primary service affected: Tenant Service API
- Root cause: A Dashboard bug caused repeated and unnecessary API calls
- Data-plane impact: Cloudflare stated that cached-file delivery and other Edge security features were not affected
- Main user impact: Customers experienced problems making configuration changes or using the Dashboard
This was primarily a control-plane outage, not a full data-plane outage. Websites could continue serving traffic even while customers were unable to manage settings normally.
Source: Cloudflare September 12, 2025 Dashboard and API postmortem.
Cloudflare outage on February 20, 2026
On February 20, 2026, a subset of customers using Cloudflare’s Bring Your Own IP service saw routes withdrawn through Border Gateway Protocol.
- Impact began: Approximately 17:56 UTC
- Root cause: A broken subprocess in the Addressing API
- Impact: Some BYOIP routes were withdrawn or removed
- Mitigation began: 19:11 UTC
- Some prefixes mitigated: 19:19 UTC
- Final mitigation process: 20:30 UTC
- Impact ended: 23:03 UTC
- Approximate full incident window: 5 hours and 7 minutes
The incident was limited to a subset of BYOIP customers rather than representing a universal Cloudflare network outage.
Source: Cloudflare outage on February 20, 2026.
Cloudflare outage timeline
| Date | Service or scope | Duration or recovery window | Main cause |
|---|---|---|---|
| February 6, 2025 | R2 and dependent services | 59-minute primary window | R2 Gateway accidentally disabled |
| March 21, 2025 | R2 and dependent services | 1 hour 7 minutes | Credential-rotation deployment error |
| June 12, 2025 | Workers KV, Access, WARP, Dashboard, others | Up to 2 hours 28 minutes | Workers KV dependency failure |
| September 12, 2025 | Dashboard and related APIs | About 1 hour 15 minutes | Tenant Service overload caused by Dashboard bug |
| November 18, 2025 | Core network traffic and multiple services | Core impact about 3 hours 10 minutes; full restoration by 17:06 UTC | Invalid Bot Management configuration |
| December 5, 2025 | Approximately 28% of Cloudflare-served traffic or applications | About 25 minutes | Configuration changes related to React vulnerability mitigation |
| February 20, 2026 | Subset of BYOIP customers | Approximately 5 hours 7 minutes to full recovery | Broken Addressing API subprocess |
Cloudflare reliability lessons
Network availability and control-plane availability are different
A Dashboard or API outage does not necessarily mean that websites behind Cloudflare stop serving traffic. The September 2025 Dashboard incident is an example: management functions were affected while Cloudflare’s Edge delivery continued operating.
Product dependencies can expand the blast radius
The June 2025 Workers KV incident affected multiple products because they depended on the same storage system. Cloudflare’s subsequent KV redesign specifically focused on redundancy and removing single points of failure.
A large network does not eliminate configuration risk
The November and December 2025 outages were linked to internal software or configuration changes rather than external attacks. Distributed infrastructure can reduce the effect of some failures, but a bad configuration propagated globally can still create broad impact.
Regional failures are not the same as global outages
BYOIP route withdrawals, regional congestion, and data-center incidents may affect a subset of customers or locations. Article titles should distinguish between global network outages, product outages, control-plane outages, regional outages, customer-specific routing incidents, scheduled maintenance, and third-party dependency incidents.
Does Cloudflare publish a 99.99% uptime figure?
Cloudflare does not publish one universal uptime percentage for all products and all customers. Availability depends on the individual service, plan, region, SLA, and measurement period.
Therefore, avoid writing:
“Cloudflare has 99.99% uptime globally.”
A more accurate statement is:
“Cloudflare publishes product-specific service-level commitments and incident postmortems, but it does not provide one universal uptime percentage covering its entire network and every product.”
How Cloudflare improves resilience
Following the November and December 2025 outages, Cloudflare launched Code Orange: Fail Small. The initiative focused on reducing the blast radius of changes and improving failure containment.
Cloudflare later stated that the Code Orange resilience work was complete and included safer configuration changes, stronger validation, automated best practices, better failure isolation, improved testing, more controlled feature rollouts, and safeguards against global propagation of bad changes.
Cloudflare emphasized that resilience work is ongoing rather than a permanently completed task.
Sources: Code Orange: Fail Small resilience plan and Code Orange completion update.
Reliability statistics that are not publicly disclosed
Cloudflare does not publicly provide one consolidated dataset containing:
- Universal network uptime
- Product-by-product annual uptime
- Total customer minutes affected
- Revenue lost by customers during incidents
- Exact number of affected websites for every outage
- Exact number of end users affected
- Annual downtime by product
- Mean time between failures across all services
- Mean time to recovery across all incidents
- SLA-credit totals
- Complete incident count using one consistent severity definition
This means reliability comparisons should use incident-specific official postmortems rather than an unsupported single uptime score.
Final reliability assessment
Cloudflare’s network has substantial redundancy, global reach, and high processing capacity. It connects to more than 13,000 networks and places approximately 95% of Internet-connected people within 50 milliseconds of a Cloudflare data center.
At the same time, Cloudflare’s 2025–2026 incident history shows that reliability must be assessed by product and failure domain. The June 2025 Workers KV outage, September 2025 Dashboard outage, November 2025 global traffic outage, December 2025 traffic incident, and February 2026 BYOIP outage had different causes, scopes, and recovery timelines.
The most accurate conclusion is:
Cloudflare operates a highly distributed global network, but it does not have one universal uptime figure. Its reliability profile depends on the specific product, control plane, data plane, region, dependency chain, and incident type being measured.
Cloudflare Statistics That Are Not Publicly Disclosed
Cloudflare does not publicly disclose every metric readers may search for. The following figures should not be invented:
- Exact monthly active users
- Exact daily active users
- Exact number of protected websites by product
- Total active Zero Trust seats
- Complete current developer activity
- Product-level revenue for every Cloudflare service
- Number of moderation or security analysts
- Total global requests across every product
- Exact customer retention by product
- Full outage-impact totals for every incident
This is one of the most important differences between a reliable statistics article and a generic listicle. Not knowing a number is better than presenting an unsupported estimate as fact.
How to Read Cloudflare Statistics Correctly
Keep the following rules in mind when using Cloudflare data:
- Use Cloudflare investor releases for revenue, guidance, and cash flow.
- Use Cloudflare Radar and DDoS reports for attack and Internet-trend statistics.
- Use W3Techs for independent website-technology adoption estimates.
- Label Cloudflare’s network claims as company-reported figures.
- Do not treat network visibility as website market share.
- Do not treat detected website usage as paying-customer count.
- Separate GAAP from non-GAAP financial results.
- Keep actual results separate from financial guidance.
- State the reporting date beside every statistic.
- Do not describe a record-size DDoS attack as a typical attack.
Frequently Asked Questions About Cloudflare
Find answers about Cloudflare revenue, customers, website usage, network size, DDoS protection, and market share.
What percentage of websites use Cloudflare?
W3Techs reported that Cloudflare was used by 17.7% of all websites in its August 8, 2026 DNS-provider comparison. Adoption was higher among ranked websites.
How much revenue does Cloudflare generate?
Cloudflare generated $696.1 million in Q2 2026 revenue and reported $2.1679 billion in FY2025 revenue.
How many customers does Cloudflare have?
Cloudflare reported approximately 4,698 customers paying more than $100,000 annually in its latest investor-relations data. Use the latest official filing for the total customer count.
How many cities does Cloudflare operate in?
Cloudflare’s public network page lists 337 cities across eight regions and more than 13,000 network interconnections.
How many cyber threats does Cloudflare block daily?
Cloudflare’s public pages report approximately 209 billion to more than 234 billion daily cyber threats, depending on the page and reporting scope.
How many DDoS attacks did Cloudflare mitigate in 2025?
Cloudflare reported 47.1 million DDoS attacks in 2025, representing a 121% increase from the previous year.
What was the largest DDoS attack Cloudflare mitigated?
The largest publicly reported event in the 2025 reporting cycle peaked at 31.4 Tbps and lasted approximately 35 seconds.
How many DDoS attacks did Cloudflare mitigate in H1 2026?
Cloudflare reported 23.2 million network-layer DDoS mitigations during the first half of 2026 and 29.64 trillion HTTP DDoS requests mitigated.
How fast is Cloudflare growing?
Cloudflare’s Q2 2026 revenue increased 36% year over year to $696.1 million.
Does Cloudflare publish the exact number of active users?
No verified public monthly-active-user or daily-active-user figure was located. Cloudflare reports business customers, developers, network traffic, and security telemetry rather than a consumer-style active-user total.
Conclusion: Cloudflare’s Scale Extends From Revenue to Internet Infrastructure
Cloudflare’s latest statistics describe a company that has expanded well beyond traditional CDN services. Q2 2026 revenue reached $696.1 million, FY2025 revenue reached $2.1679 billion, and the company’s FY2026 revenue guidance is approximately $2.864 billion to $2.870 billion.
Its network now spans 337 cities, connects to more than 13,000 networks, and places approximately 95% of the world’s Internet-connected population within 50 milliseconds of a Cloudflare data center.
The security statistics are equally significant. Cloudflare reported 47.1 million DDoS attacks in 2025, while its H1 2026 report recorded 23.2 million network-layer attacks and 29.64 trillion HTTP DDoS requests.
The main qualification is that Cloudflare statistics come from different measurement systems. Revenue is company-reported, website usage is independently estimated, and threat-volume figures are based on Cloudflare’s own network telemetry. Keeping those definitions separate is essential for an accurate article.
As of August 2026, Cloudflare’s numbers show a fast-growing connectivity-cloud company with increasing enterprise adoption, global network reach, expanding developer and AI capabilities, and an increasingly important role in Internet security.