150 AI Statistics In 2026: Adoption, Usage, ROI, Jobs & Market Trends
Source standard: official data, original research, and first-party disclosures
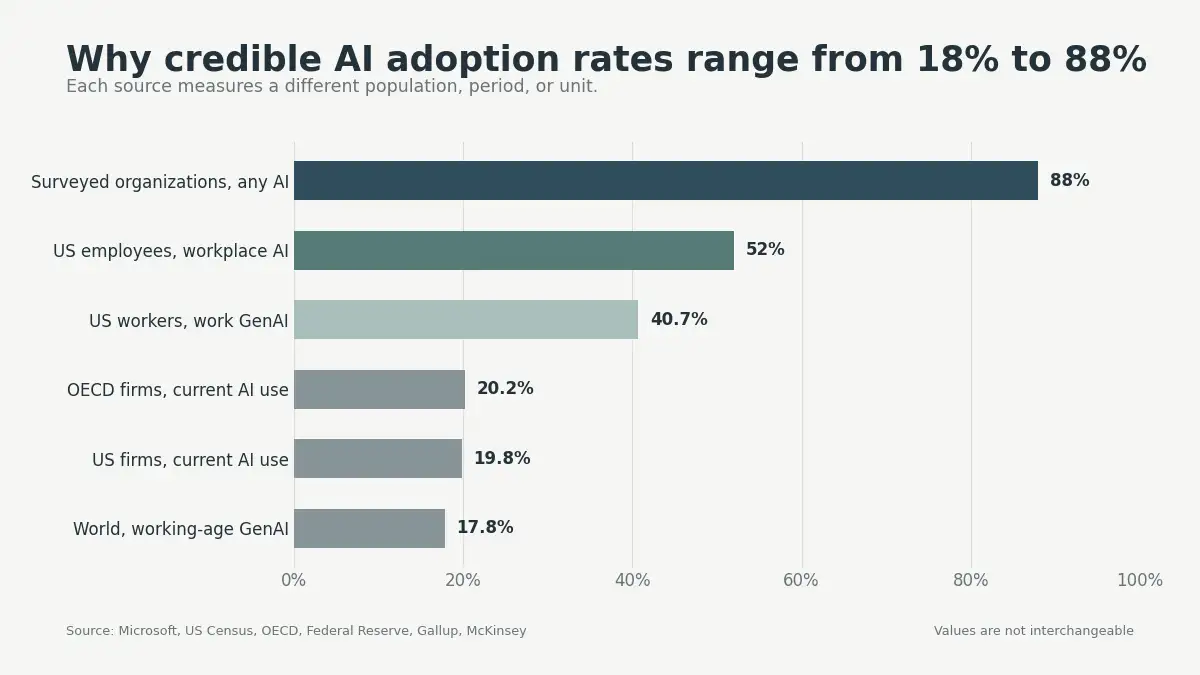
AI adoption is widespread, but business value remains uneven. McKinsey reports 88% usage across surveyed organizations. Official firm surveys place adoption near 20%. Both numbers remain credible because they measure different groups.
This guide separates reach, scale, value, risk, and readiness. Every forecast, survey, and vendor claim carries a label and verified source.
All figures were checked on August 10, 2026. Sources link directly to reports or official disclosures.
Credible AI adoption rates range from 18% to 88%
AI adoption has no single, universal business measure. Different studies count firms, workers, executives, or product users. Their results answer different questions, not competing versions.
Readers should check every denominator before comparing percentages.
| Question | Best current answer | What the number measures |
|---|---|---|
| How many surveyed organizations use AI somewhere? | 88% | Organization respondents reporting one functional use |
| How many US firms use AI currently? | 17% to 20% | Nationally representative, firm-weighted Census estimates |
| How many OECD firms use AI? | 20.2% | Harmonized official business surveys across available countries |
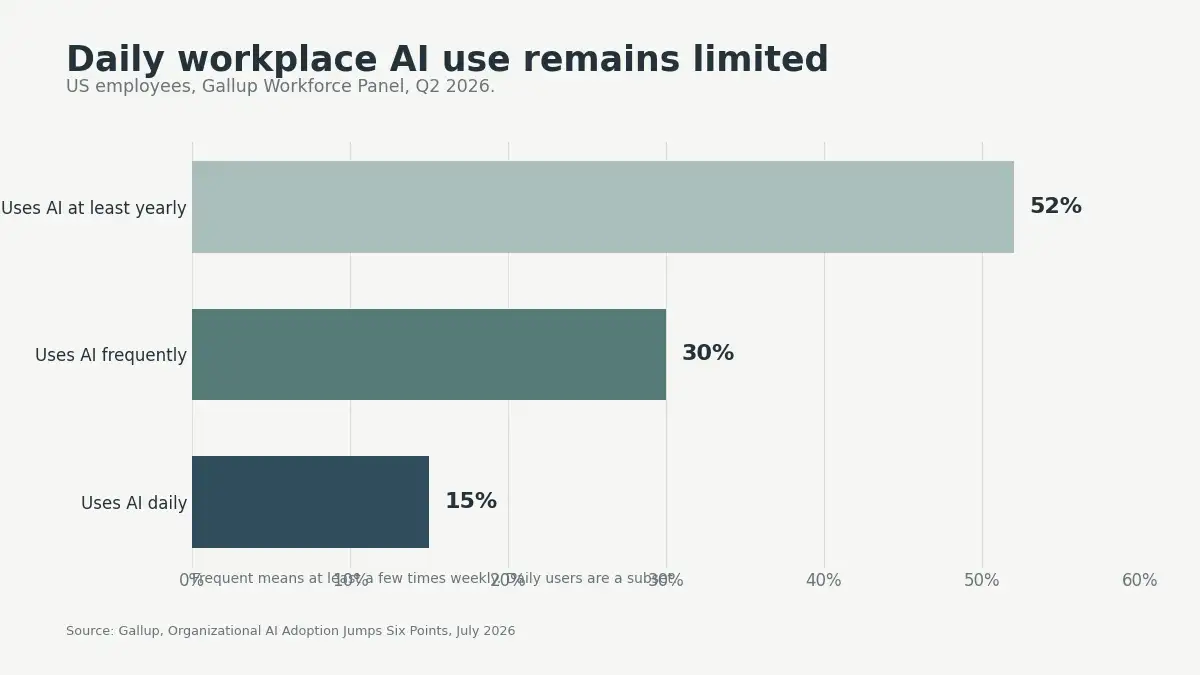
| How many US workers use workplace AI? | 52% | Employees using any AI at least occasionally |
| How many workers use professional generative AI? | 40.7% | Individual worker use from the Federal Reserve review |
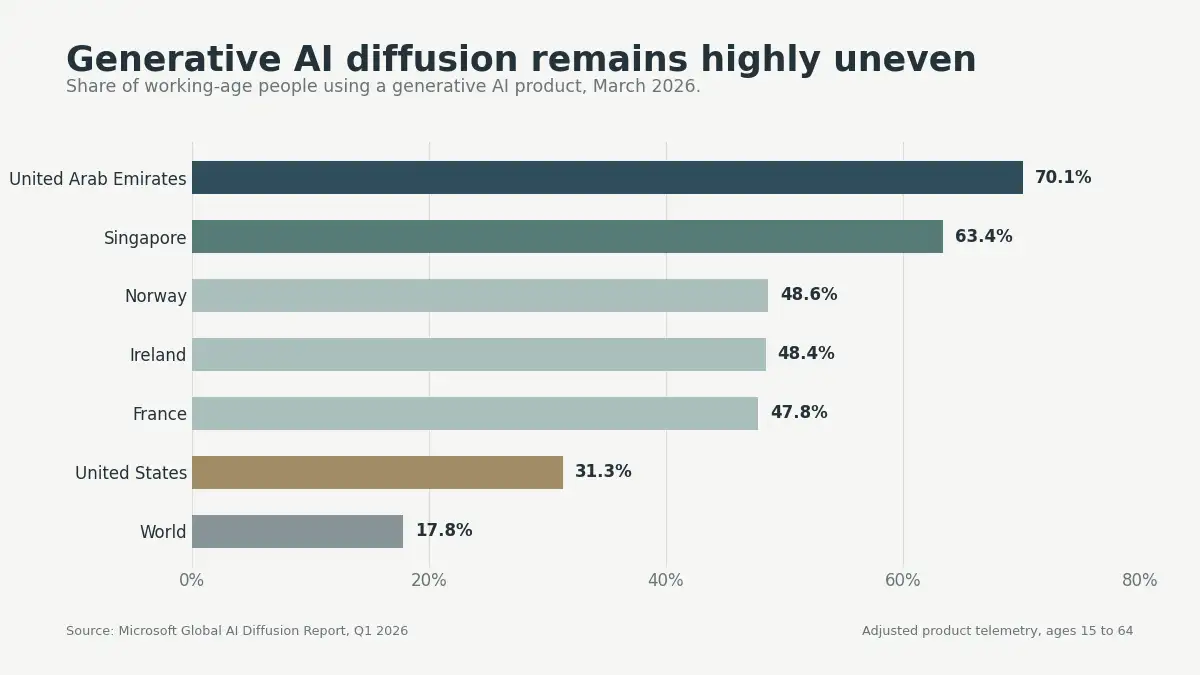
| How many working-age people use generative AI globally? | 17.8% | Adjusted Microsoft product telemetry across countries |
The Federal Reserve explains these differences clearly.
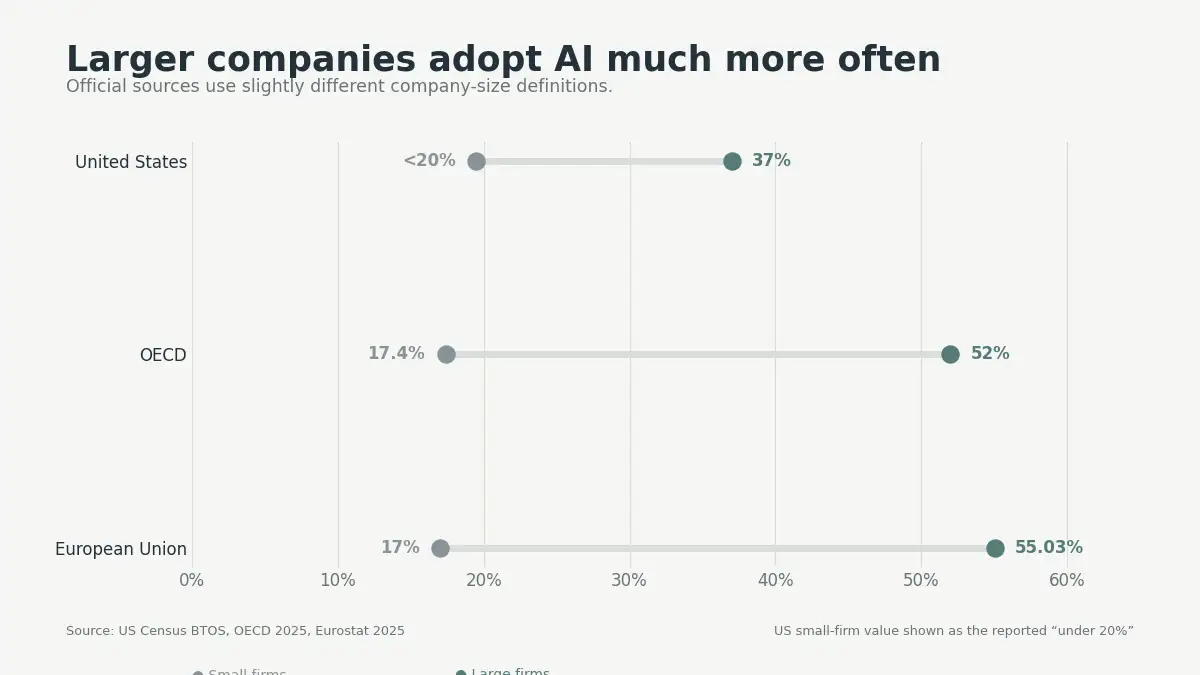
Large firms adopt AI more often than small firms. Employment weighting therefore raises firm-level adoption estimates. Workers may also use unapproved tools without employer knowledge.
Verdict: use the 88% figure for surveyed organizations. Use official figures near 20% for all-firm comparisons. Never present either figure without its denominator.
AI usage is broad, but enterprise value remains concentrated
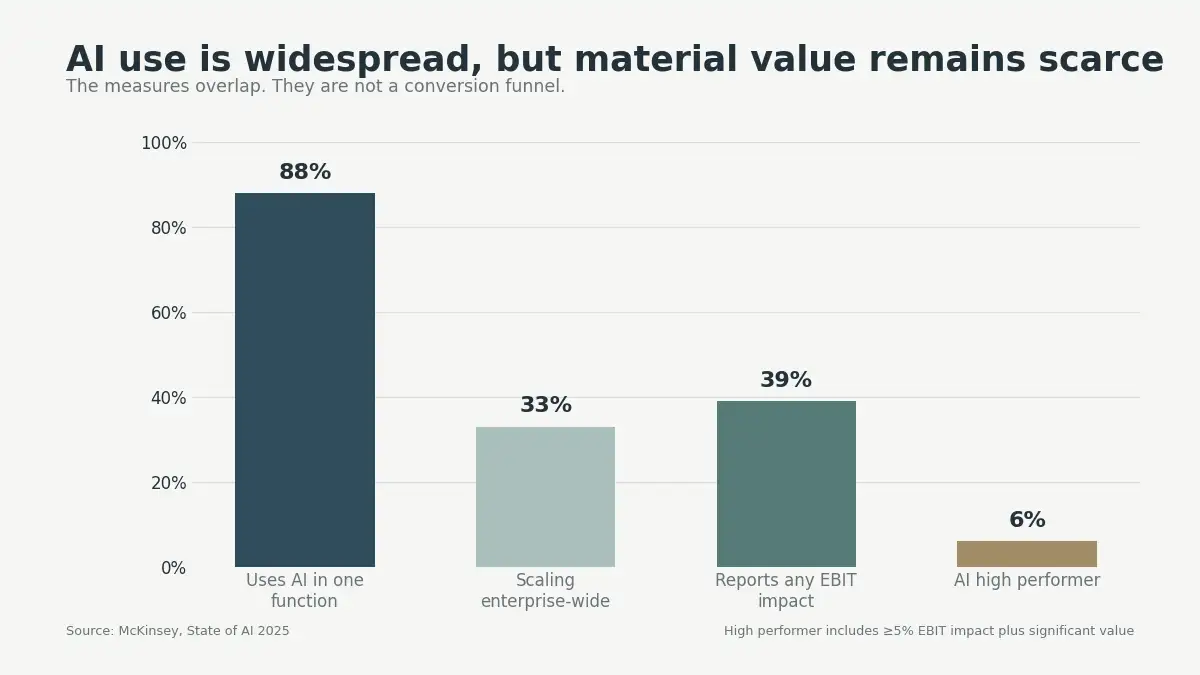
Most surveyed organizations now use AI somewhere. Far fewer scale systems across their whole business. Financial returns remain concentrated among a small group. Workflow changes separate leaders from casual users.
Organization adoption and agent scale
The McKinsey State of AI 2025 surveyed 1,993 respondents across 105 countries. Statistics 1 through 16 use its organization-level findings.
| # | Metric | Value | Period |
|---|---|---|---|
| 1 | Organizations using AI in at least one function | 88% (vs 78% a year earlier) | 2025 |
| 2 | Organizations using generative AI in one function | 79%; 33% in 2023 | 2025 |
| 3 | Organizations experimenting with or scaling AI agents | 62% (23% scaling + 39% experimenting) | 2025 |
| 4 | Organizations scaling AI agents somewhere | 23% | 2025 |
| 5 | Highest scaled agent use within one function | ≤10% in every function | 2025 |
| 6 | Organizations scaling AI across the enterprise | ~33% | 2025 |
| 7 | Organizations using AI in multiple functions | >66% | 2025 |
| 8 | Organizations using AI in three or more functions | 50% | 2025 |
| 9 | Respondents reporting AI supports innovation | 64% | 2025 |
| 10 | Organizations reporting any enterprise EBIT impact | 39% | 2025 |
| 11 | McKinsey AI high performers | ~6% | 2025 |
| 12 | AI users reporting one negative consequence | 51% | 2025 |
| 13 | Respondents reporting harm from AI inaccuracy | ~33% | 2025 |
| 14 | Expected workforce reductions above three percent | 32% | Next 12 months from 2025 survey |
| 15 | Expected little or no workforce change | 43% | Next 12 months from 2025 survey |
| 16 | Expected workforce increases above three percent | 13% | Next 12 months from 2025 survey |
Process change and financial outcomes
Deloitte surveyed 3,235 leaders across 24 countries, and PwC surveyed 4,554 chief executives across 95 markets.
| # | Metric | Value | Period |
|---|---|---|---|
| 17 | Organizations reporting efficiency or productivity gains | 66% | 2025 survey, reported in 2026 |
| 18 | Organizations using AI for deep business change | 34% | 2025 survey, reported in 2026 |
| 19 | Organizations redesigning important processes | 30% | 2025 survey, reported in 2026 |
| 20 | Surface users, CEOs with both gains, CEOs with neither | 37% surface use; 12% both gains; 56% neither | 2025 surveys, reported in 2026 |
The pattern remains consistent across both business surveys. Efficiency gains appear before measurable revenue growth. Surface use rarely changes operating results materially. Deep process redesign creates a clearer path toward value.
Official firm adoption sits near 20% across major economies
Official data shows slower adoption than executive surveys. These surveys cover small firms and traditional industries. Company size creates the clearest adoption divide. Knowledge-heavy sectors remain far ahead of construction and retail.
US firm adoption and business functions
The US Census Bureau tracks business AI use every two weeks. Its 2026 AI supplement also measures functions, tasks, and employment effects.
| # | Metric | Value | Period |
|---|---|---|---|
| 21 | US businesses using AI in current operations | 17%-20%; 19.8% latest | Dec 14, 2025-May 3, 2026 |
| 22 | US businesses expecting AI use within six months | 20%-23% | Dec 2025-May 2026 |
| 23 | US firms with at least 250 employees using AI | 37% | Collection ending May 3, 2026 |
| 24 | US firms with 100 to 249 employees using AI | 32% | Collection ending May 3, 2026 |
| 25 | Information sector firms using AI | 39.7% | Collection ending May 3, 2026 |
| 26 | Finance and insurance firms using AI | 33.9% | Collection ending May 3, 2026 |
| 27 | Retail firms using AI now and within six months | ~14% current; ~17% expected | Collection ending May 3, 2026 |
| 28 | US firms using AI, firm and employment weighted | 18% firm-weighted; 32% employment-weighted | Nov 2025-Jan 2026 |
| 29 | Firms reporting employee AI task use | 23% of firms; 41% employment-weighted | Nov 2025-Jan 2026 |
| 30 | AI adopters using three or fewer functions | 57% | Nov 2025-Jan 2026 |
| 31 | Functional adopters using AI in sales and marketing | 52% | Nov 2025-Jan 2026 |
| 32 | Functional adopters using AI in strategy | 45% | Nov 2025-Jan 2026 |
| 33 | Functional adopters using AI in information technology | 41% | Nov 2025-Jan 2026 |
| 34 | Task adopters using AI for writing and editing | 85%; 92% employment-weighted | Nov 2025-Jan 2026 |
| 35 | AI firms using technology only for task support | 66% | Nov 2025-Jan 2026 |
| 36 | AI firms reporting any headcount effect | ~5% any effect; +2.3%; −2.0% | Nov 2025-Jan 2026 |
OECD adoption and company size
The OECD harmonizes available national business surveys. Its figures generally cover companies with ten or more workers.
| # | Metric | Value | Period |
|---|---|---|---|
| 37 | OECD firms using AI | 20.2%; 14.2%; 8.7% | 2023-2025 |
| 38 | OECD large and small firms using AI | 52.0% vs 17.4% | 2025 |
| 39 | OECD information technology firms using AI | 57.3% | 2025 |
| 40 | OECD professional and scientific firms using AI | 36.8% | 2025 |
European Union adoption and barriers
Eurostat measures seven listed AI technology categories. Its survey covers enterprises with at least ten workers.
| # | Metric | Value | Period |
|---|---|---|---|
| 41 | European Union enterprises using AI | 19.95%; +6.47 pp | 2025 |
| 42 | European Union adoption by company size | 55.03%; 30.36%; 17.00% | 2025 |
| 43 | Leading European Union countries by enterprise adoption | 42.0%; 37.82%; 35.04% | 2025 |
| 44 | European Union adoption across selected industries | 62.52%; 40.43%; 10.79% | 2025 |
| 45 | European Union use by AI technology type | 11.75%; 9.55%; 8.76%; 1.39% | 2025 |
| 46 | European Union non-adoption barriers | 70.89%; 52.52%; 48.83% | 2025 |
Firm size matters more than headline averages suggest. Large European firms triple small-firm adoption rates. Sales, strategy, and information technology lead current business use. Expertise remains the largest documented adoption barrier.
Global AI use grows fastest among students and Asian markets
Individual use already exceeds firm adoption in many countries. Students report the highest usage across OECD populations. Asian markets posted the fastest recent diffusion growth. Platform disclosures show audiences approaching one billion users.
Individual usage across OECD populations
The OECD individual-use release compares age, income, education, and employment groups. Statistics 47 through 51 retain those group definitions.
| # | Metric | Value | Period |
|---|---|---|---|
| 47 | OECD individuals using generative AI | 36.8% | 2025 |
| 48 | OECD students using generative AI | ~75% | 2025 |
| 49 | OECD use by employment status | 41.1%; 36.7%; 12.5% | 2025 |
| 50 | OECD generative AI usage age gap | 53.6 pp | 2025 |
| 51 | OECD education, income, and gender usage gaps | ~21 pp; ~21 pp; 4.2 pp | 2025 |
Global working-age diffusion
Microsoft estimates usage through adjusted, anonymized product telemetry. Its Q1 2026 diffusion report covers people aged 15 through 64.
| # | Metric | Value | Period |
|---|---|---|---|
| 52 | Global working-age generative AI diffusion | 17.8%; 16.3%; +1.5 pp | Q1 2026 vs Q4 2025 |
| 53 | Global North and Global South diffusion | 27.5%; 15.4%; 12.1 pp | Q1 2026 |
| 54 | United Arab Emirates working-age diffusion | 70.1% | March 2026 |
| 55 | United States working-age diffusion and rank | 31.3%; rank 21 | March 2026 |
| 56 | Economies exceeding 30 percent diffusion | 26 economies | Q1 2026 |
| 57 | Fastest diffusion growth across selected Asian markets | +43%; +36%; +34% | H1 2025 to Q1 2026 |
Platform user counts
OpenAI, Alphabet, and Meta report their own user metrics. These first-party figures have not received independent audits.
| # | Metric | Value | Period |
|---|---|---|---|
| 58 | Weekly active ChatGPT users | >900 million WAU | February 2026 |
| 59 | Paid ChatGPT consumer subscribers | >50 million | February 2026 |
| 60 | OpenAI active users and business customers | >1 billion active users; >2 million businesses | August 2026 |
| 61 | OpenAI usage growth after six months | ~50% more messages/day; ~2× work types | Cohort behavior after six months, reported Aug 2026 |
| 62 | Gemini monthly and daily active users | 950 million MAU; 3× DAU | Q2 2026 |
| 63 | Google AI Mode monthly active users | >1 billion MAU | Q2 2026 |
| 64 | Google AI developers and API token volume | >9 million developers/month; 22B tokens/min vs 16B | Q2 2026 |
| 65 | Meta AI monthly active users | >1 billion MAU | 2025 |
User units require careful reading and clear labels. Weekly users cannot rank directly against monthly users. Visits, sessions, subscribers, and active users also differ. OpenAI’s later “active” figure lacks a published period.
Half of US workers use AI, but daily use stays limited
Workplace AI use crossed the halfway mark in 2026. Most workers still use AI occasionally, not daily. Writing and research remain the most common tasks. Coding and automation produce stronger reported productivity gains.
Workplace use and productivity
Gallup surveyed US employees through its probability-based Workforce Panel. Statistics 66 through 73 cover usage, tasks, and perceived outcomes.
| # | Metric | Value | Period |
|---|---|---|---|
| 66 | US employees using AI at work | 52%; 30%; 15% | Q2 2026 |
| 67 | US employees reporting organizational AI integration | 47%; +6 pp | Q2 2026 |
| 68 | Most common workplace AI uses | 51%; 49%; 39% | Q2 2026 |
| 69 | Specialized workplace AI uses | 18%; 17%; 16%; 16% | Q2 2026 |
| 70 | Highest reported productivity effects by task | 77%; 76%; 75% | Q2 2026 |
| 71 | Productivity effects by breadth of AI use | 45% → 66% → 78% → 90% | Q2 2026 |
| 72 | Employees reporting improved productivity from AI | 65%; 16%; <10% | Q1 2026 |
| 73 | Employees expecting AI-related job elimination | 18%; 23% | Q1 2026 |
Professional generative AI use
The Federal Reserve compared worker, firm, and employment-weighted measures. Its analysis prevents several common denominator mistakes.
| # | Metric | Value | Period |
|---|---|---|---|
| 74 | US workers using generative AI professionally | 40.7%; +9.7 pp; +31.3% | November 2025 |
| 75 | Daily and weekly professional generative AI use | 12% daily; 35.2% weekly | November 2025 |
| 76 | US adults using generative AI outside work | ~50%; +10.4 pp | November 2025 |
| 77 | Workers employed at AI and LLM adopting firms | 78% AI; 54% LLM | November 2025 |
| 78 | Professional generative AI use by industry | 70%; 63%; 62% | November 2025 |
| 79 | Weekly AI hours among surveyed firms | 35%; 29% | November 2025 |
More task variety correlates with stronger perceived productivity. That relationship does not establish direct causation. Experienced users may hold more suitable roles. They may also receive better tools and support.
AI changes tasks faster than it removes whole jobs
Current evidence points toward job change, not simple replacement. Employers expect significant creation and displacement together. Technical exposure affects more roles than actual automation. Skills and job requirements are changing fastest.
Global job and training forecasts
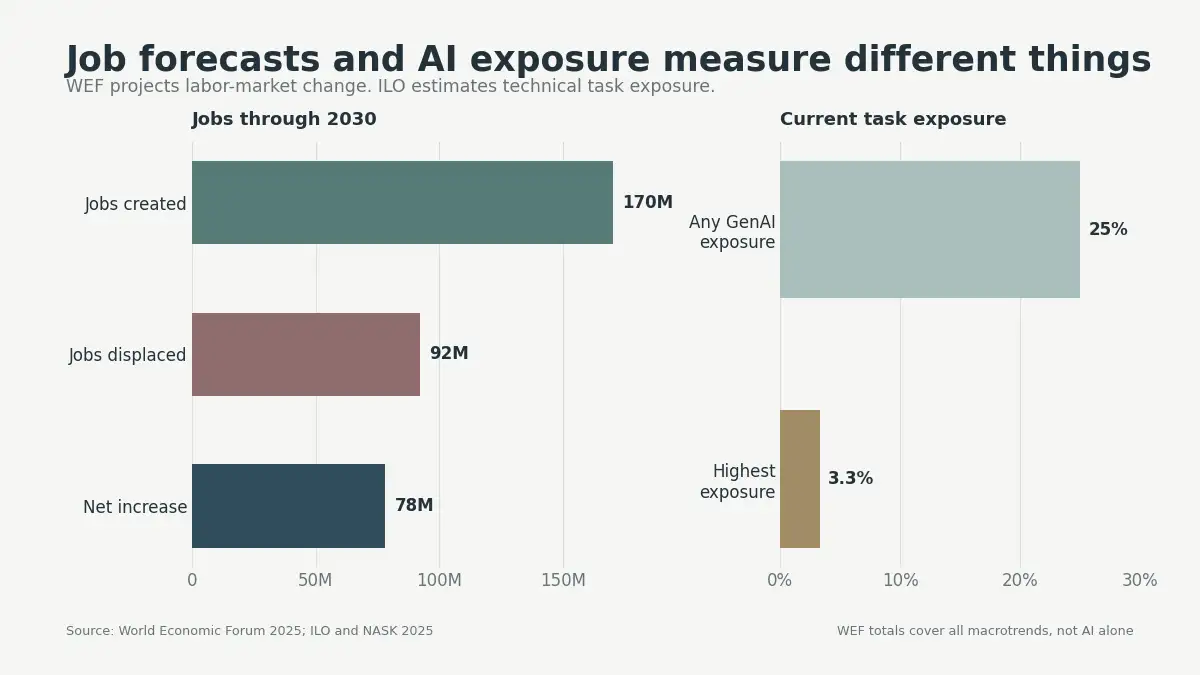
The World Economic Forum surveyed over 1,000 employers representing 14 million workers. Its job totals include every major macrotrend, not AI alone.
| # | Metric | Value | Period |
|---|---|---|---|
| 80 | Jobs created, displaced, and added by 2030 | 170M created; 92M displaced; +78M net | 2025-2030 forecast |
| 81 | Global job disruption expected by 2030 | 22% | 2025-2030 forecast |
| 82 | Core skills expected to change | 39% | By 2030 |
| 83 | Employers citing skills gaps as a barrier | 63% | 2024 survey / 2025 report |
| 84 | Workers needing training and missing training | 59 of 100; 11 without training; >120M | By 2030 |
| 85 | Employers planning upskilling and workforce reductions | 77%; 41% | By 2030 |
Occupational exposure by income and gender
The ILO and NASK exposure index evaluates almost 30,000 occupational tasks. Exposure measures technical potential, not confirmed job losses.
| # | Metric | Value | Period |
|---|---|---|---|
| 86 | Jobs with any and highest generative AI exposure | 25%; 3.3% | Early 2025 snapshot |
| 87 | Highest exposure among women and men | 4.7% vs 2.4% | Early 2025 snapshot |
| 88 | Exposure across high-income and low-income countries | 34% vs 11%; 9.6% vs 3.5% | Early 2025 snapshot |
Productivity, wages, and changing requirements
PwC’s 2026 AI Jobs Barometer analyzed over one billion job advertisements. It combined job requirements with company financial information.
| # | Metric | Value | Period |
|---|---|---|---|
| 89 | Productivity growth at highly exposed companies | 40% higher | Post-2022 company performance |
| 90 | Productivity growth among the top exposed company group | 163% | Since 2022 / report analysis |
| 91 | Skill change and human skill requirements | >2× skill change; 2.5× human-skill intensity | Analysis through 2025 |
| 92 | Professionalized jobs, wages, and junior skill demands | 2× job growth; +42% wage growth; 7× senior-skill demand | 2019-2025 / since 2021 wage comparison |
The job outlook contains gains, losses, and changed roles. Entry-level jobs increasingly request judgment and leadership skills. That shift may narrow traditional learning pathways. Employers should pair automation with training and internal mobility.
AI investment grows faster than proven financial returns
AI funding and spending reached new highs during 2025. Planned corporate budgets also doubled as revenue shares. Infrastructure receives the largest capital commitments. Measured returns still trail this spending growth.
Private investment and consumer value
The Stanford 2026 AI Index economy chapter compiles investment and economic datasets. Consumer value estimates measure surplus, not company revenue.
| # | Metric | Value | Period |
|---|---|---|---|
| 93 | Global private AI investment growth and share | +127.5%; 60% share | 2025 |
| 94 | Generative AI investment growth and share | >200%; ~50% share | 2025 |
| 95 | Growth in newly funded AI companies | +71% | 2025 |
| 96 | Growth in billion-dollar AI funding events | Nearly 2× | 2025 |
| 97 | Private AI investment in the United States and China | $285.9B vs $12.4B; 23.1× | 2025 |
| 98 | Newly funded AI companies in the United States | 1,953; >10× | 2025 |
| 99 | US consumer value from generative AI | $172B vs $112B; +54%; median 3× | Early 2026 vs one year earlier |
Venture capital concentration
The OECD venture capital analysis separates investor location from company location. Statistics 100 through 102 use company destination figures.
| # | Metric | Value | Period |
|---|---|---|---|
| 100 | AI share of global venture capital | 61%; $258.7B / $427.1B | 2025 |
| 101 | Venture capital for AI infrastructure and hosting | $109.3B; $256.1B cumulative | 2025; 2012-2025 |
| 102 | AI venture capital attracted by region | 75%/$194B; 6%; 5%; 5% | 2025 |
Corporate spending intentions
BCG’s AI Radar 2026 surveyed 2,360 executives across 16 markets. Its spending figures reflect plans, not audited financial statements.
| # | Metric | Value | Period |
|---|---|---|---|
| 103 | Planned AI spending as a revenue share | 0.8% → 1.7% | 2025 to 2026 plan |
| 104 | Organizations continuing AI investment without returns | 94% | 2026 |
| 105 | Chief executives directing AI decisions | 72%; ~2× YoY | 2026 |
| 106 | Chief executives linking their jobs to AI outcomes | 50% | 2026 |
| 107 | Chief executives expecting measurable agent returns | ~90% | 2026 expectation |
Models, agents, servers, and infrastructure
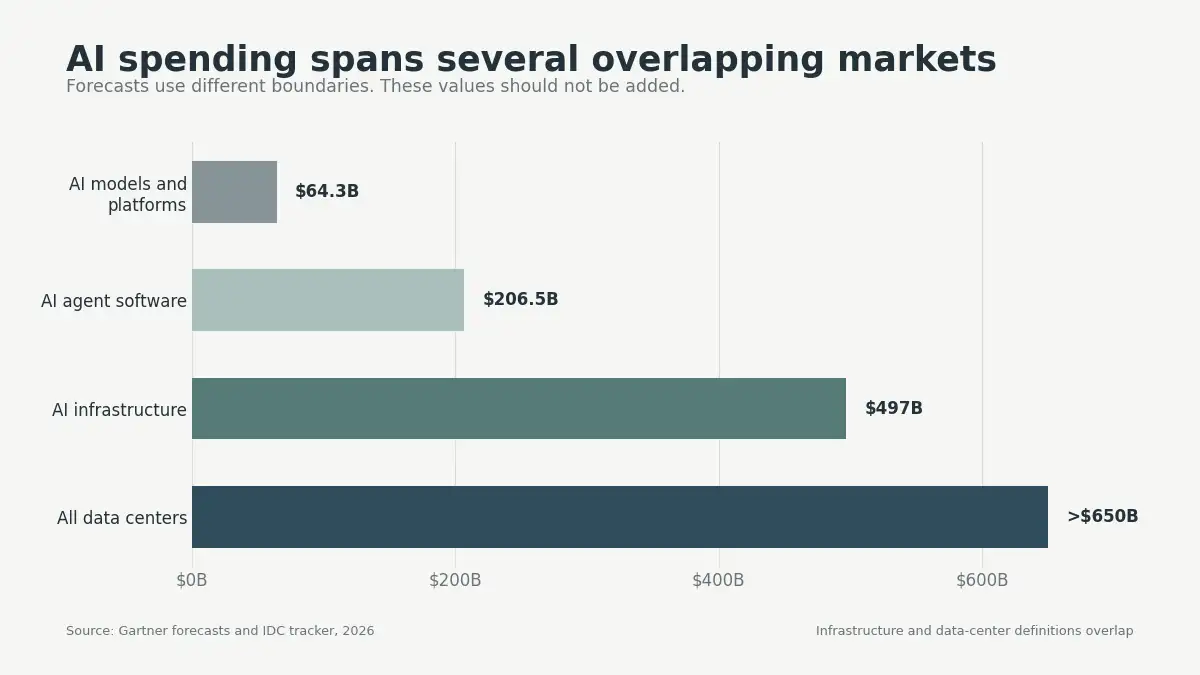
Gartner forecasts defined software and infrastructure segments. IDC tracks AI infrastructure using another market definition.
| # | Metric | Value | Period |
|---|---|---|---|
| 108 | Worldwide spending on AI models and platforms | $64.252B; +63.4% | 2026 forecast |
| 109 | Spending on specialized and foundation models | $4.91B/+210%; $23.356B/+104.2% | 2026 forecast |
| 110 | AI agent software spending | $86.4B → $206.5B → $376.3B | 2025 actual/estimate; 2026-2027 forecast |
| 111 | Data center and server spending | >$650B/+31.7%; servers +36.9% | 2026 forecast |
| 112 | AI infrastructure spending | $89.7B/+33.1%; FY $497B/~+56% | Q1 and full-year 2026 |
These spending categories should never form one grand total. Models, agents, servers, data centers, and venture funding overlap. Each estimate uses a different market boundary. Segment labels matter more than one headline number.
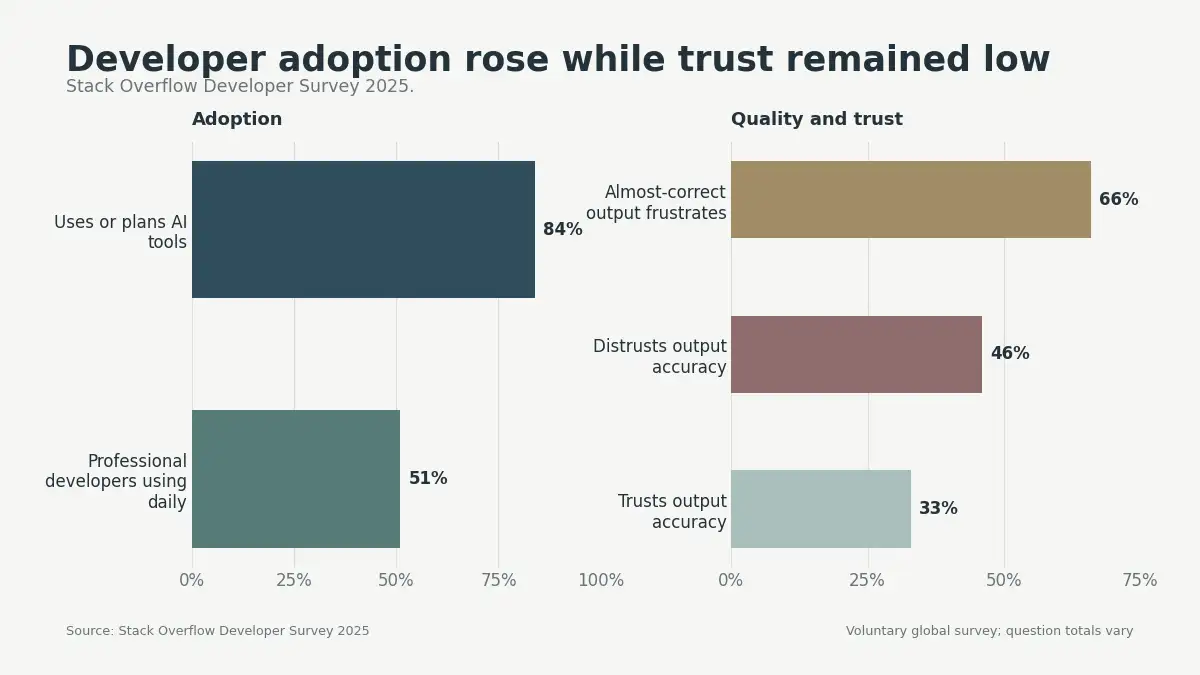
Developers use AI widely, but trust its output less
Developer adoption continues rising while confidence keeps falling. Almost-correct output creates review and debugging costs. Agents improve productivity for many current users. Accuracy and security remain their leading concerns.
Developer adoption and trust
The Stack Overflow Developer Survey 2025 received over 49,000 responses from 177 countries. Individual question totals vary across the survey.
| # | Metric | Value | Period |
|---|---|---|---|
| 113 | Developers using or planning AI tools | 84% vs 76%; 51% daily | 2025 |
| 114 | Developer trust and distrust in AI accuracy | 46%; 33%; 3% | 2025 |
| 115 | Developer frustration with almost-correct AI output | 66%; 45% | 2025 |
| 116 | Developer use and plans for AI agents | 31%; 17%; 38% | 2025 |
| 117 | Agent productivity and developer concerns | 69%; 87%; 81% | 2025 |
| 118 | Developers viewing AI as no job threat | 64% vs 68% | 2025 vs 2024 |
GitHub platform activity
GitHub Octoverse 2025 covers public activity from September 2024 through August 2025. Its figures describe GitHub users, not every global developer.
| # | Metric | Value | Period |
|---|---|---|---|
| 119 | GitHub developer growth | >180M; +36.2M; +23% | Sep 2024-Aug 2025 |
| 120 | AI repositories, model software kits, and contributions | 4.3M; 1.1M/+178%; 1.9M/+76% | Sep 2024-Aug 2025 |
| 121 | Copilot use, open-source adoption, and agent pull requests | ~80%; 50%; >1M PRs | 2025 |
AI speeds production, but review remains essential. Faster code creation can also increase review volume. Teams should track defects, rework, and deployment incidents. Acceptance rates alone provide an incomplete quality measure.
Physicians use AI routinely, while health governance trails
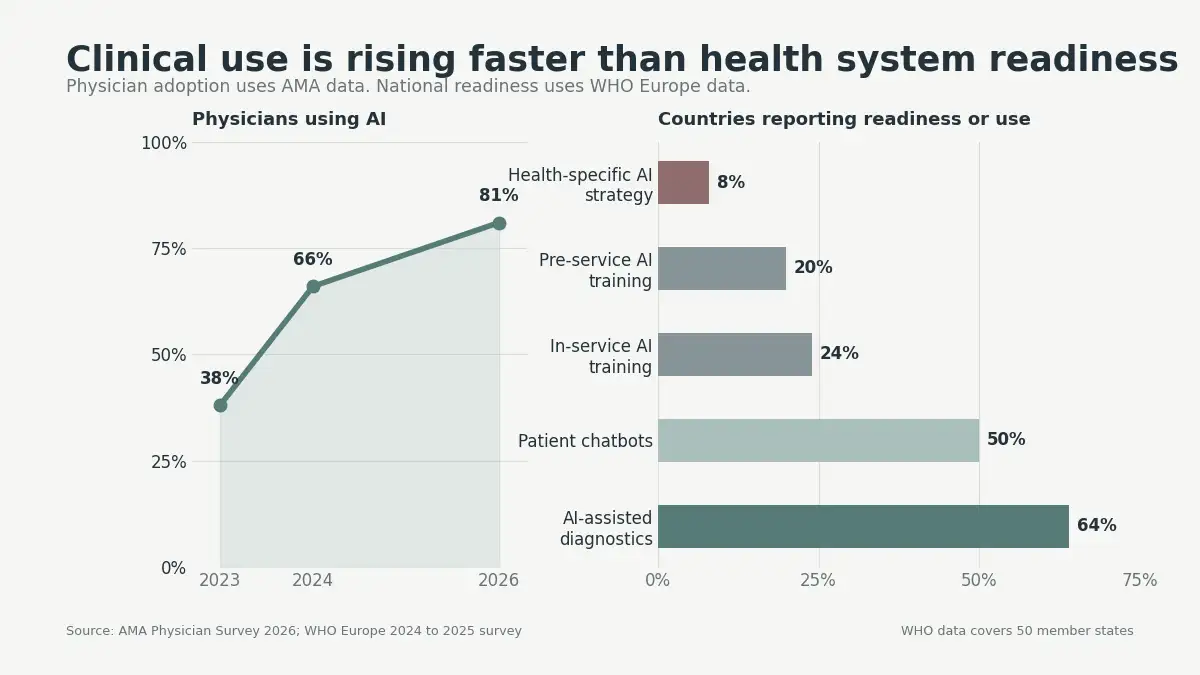
Professional AI use now covers most surveyed physicians. Research summaries and documentation lead clinical usage. Physicians still want validation, privacy, training, and involvement. National governance remains behind operational adoption.
Physician use and safeguards
The AMA Physician Survey included nearly 1,700 doctors during 2026. Item-level response totals differ across the report.
| # | Metric | Value | Period |
|---|---|---|---|
| 122 | Physicians using AI professionally | 81% vs 38% | 2026 vs 2023 |
| 123 | Average physician AI use cases | 1.1 → 2.3 | 2023-2026 |
| 124 | Physician confidence and mixed feelings | >75% vs 65%; 40% | 2026 vs 2023 |
| 125 | Physician views on burnout and skill loss | 70%; 88% | 2026 |
| 126 | Physician uses, safeguards, involvement, and training | 39%; 30%; 28%; 28%; 86%; 88%; 85%; 92% | 2026 |
Health system readiness and regulated devices
The World Health Organization surveyed 50 European-region countries. The FDA tracks authorized medical devices containing AI.
| # | Metric | Value | Period |
|---|---|---|---|
| 127 | European health AI strategy, use, and training | 8%; 64%; 50%; 20%; 24% | 2024-2025 survey |
| 128 | FDA devices, annual authorizations, and trial evidence | >1,200 cumulative; 258 in 2025; 2.4% | Through 2025 |
Device authorization does not guarantee equal clinical evidence. Many devices enter through modification-based regulatory pathways. Health systems need monitoring after deployment. Clinicians also need clear responsibility and escalation rules.
AI risk costs rise when governance and access controls lag
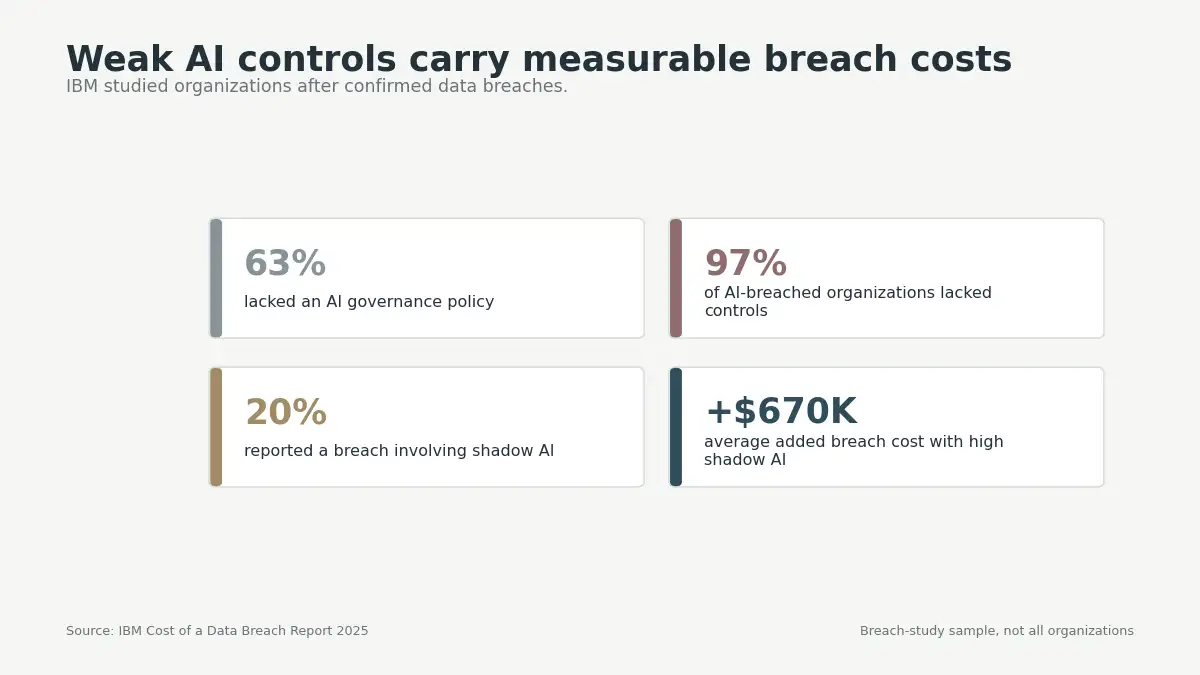
Weak governance creates measurable security and operational costs. Shadow AI adds unmanaged data exposure and breach expenses. AI also assists both attackers and defenders. Responsible AI programs are growing, but transparency declined.
Security, shadow AI, and breach costs
The IBM Cost of a Data Breach 2025 studied organizations after confirmed data breaches. These findings do not represent every organization worldwide.
| # | Metric | Value | Period |
|---|---|---|---|
| 129 | Organizations with AI breaches and missing access controls | 13%; 97% | 2025 |
| 130 | Breached organizations missing AI governance policies | 63% | 2025 |
| 131 | Governed organizations auditing unsanctioned AI | 34% | 2025 |
| 132 | Shadow AI incidents and added breach costs | 20% vs 13%; +$670K | 2025 |
| 133 | Data exposed during shadow AI incidents | 65% vs 53%; 40% vs 33% | 2025 |
| 134 | AI-assisted attacks, phishing, and deepfakes | 16%; 37%; 35% | 2025 |
| 135 | Security automation savings and faster containment | 80 days; $1.9M | 2025 |
Incidents, governance, and public trust
The Stanford 2026 AI Index combines incident, benchmark, policy, and survey evidence. Its public opinion chapter compares experts with national public samples.
| # | Metric | Value | Period |
|---|---|---|---|
| 136 | Documented AI incidents | 362 vs 233 | 2024-2025 |
| 137 | Hallucination rates across evaluated models | 22%-94% | 2025 evaluations |
| 138 | AI governance roles and responsible AI policies | +17%; 24% → 11% | 2025 |
| 139 | Responsible AI implementation barriers | 59%; 48%; 41% | 2025 |
| 140 | Influence from GDPR, ISO standards, and NIST guidance | 60%; 36%; 33% | 2025 |
| 141 | Foundation model transparency score | 40 vs 58 | 2024-2025 |
| 142 | Public trust in government AI regulation | 31%; 54%; 81%; 76% | 2025 survey data |
| 143 | Expert and public expectations for AI outcomes | 73/23%; 69/21%; 84/44% | 2025 survey data |
Governance should follow actual system access and risk. A policy document alone cannot detect shadow tools. Teams also need inventories, permissions, testing, and incident plans. Regular audits help connect written rules with daily behavior.
AI infrastructure demand rises despite efficiency gains
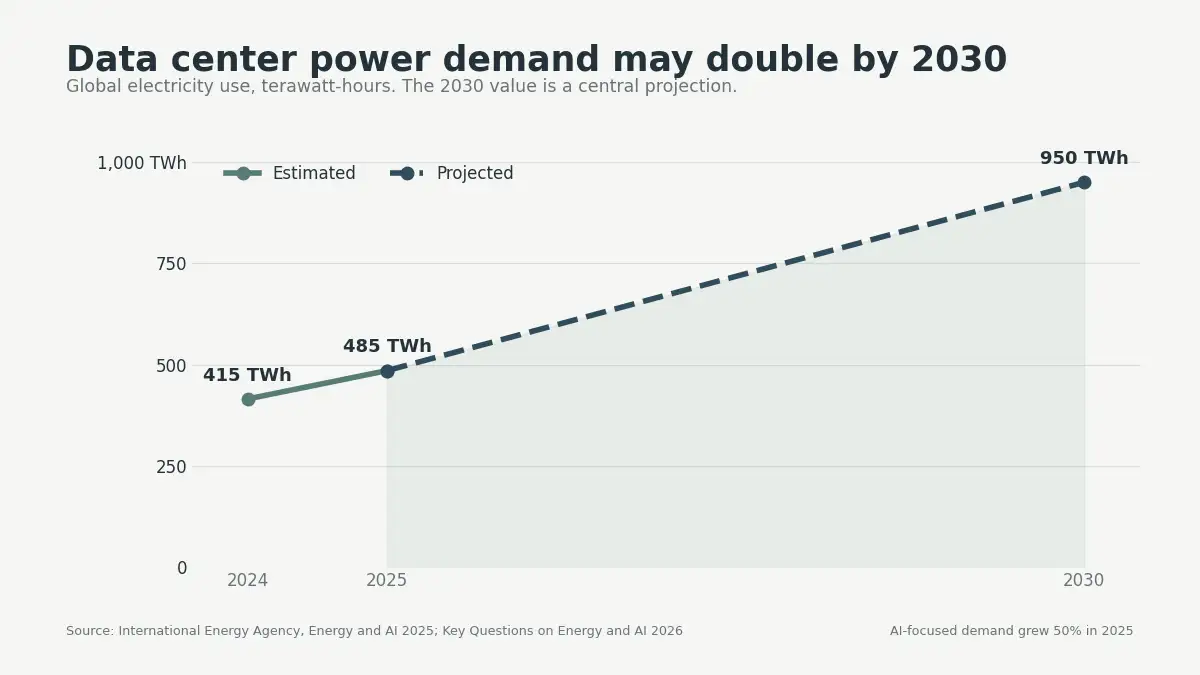
Model efficiency improves, but total usage grows faster. Compute, electricity, cooling, and water remain binding constraints. Data center power demand rose sharply during 2025. Local grid pressure matters more than global averages.
Compute, energy, and model performance
The Stanford research chapter tracks compute concentration and environmental estimates. The IEA models global electricity demand and physical constraints.
| # | Metric | Value | Period |
|---|---|---|---|
| 144 | Global AI compute capacity and supplier share | 17.1M H100-eq; 3.3×/yr; >60% | 2022-2025 |
| 145 | US data centers and AI power capacity | 5,427; >10×; 29.6 GW | 2025 |
| 146 | Estimated model emissions and water use | 72,816 tCO2e; >1.2M people equivalent | 2025 estimates |
| 147 | Data center electricity demand and growth | 485 TWh/+17%; AI +50%; ~950 TWh by 2030 | 2025 actual estimate; 2030 forecast |
| 148 | Advanced server rack power density and heat | 65 households; 11×; 4×; 30 boilers | 2020-2027 |
The Stanford technical chapter also tracks agents, benchmarks, and model competition. Statistics 149 and 150 use those evaluations.
| # | Metric | Value | Period |
|---|---|---|---|
| 149 | AI agent accuracy on computer tasks | ~12% → 66.3%; ~1 in 3 failures | 2024-2025/Mar 2026 report |
| 150 | Closed model, open model, and country performance gaps | 3.3% vs 0.5%; 2.7%; up to 42% error | Aug 2024-Mar 2026 |
Environmental estimates depend heavily on technical assumptions. Model providers rarely publish complete energy and water data. Location also changes emissions and water impact. Articles should describe these numbers as estimates.
India leads scaled use, but governance depth remains uneven
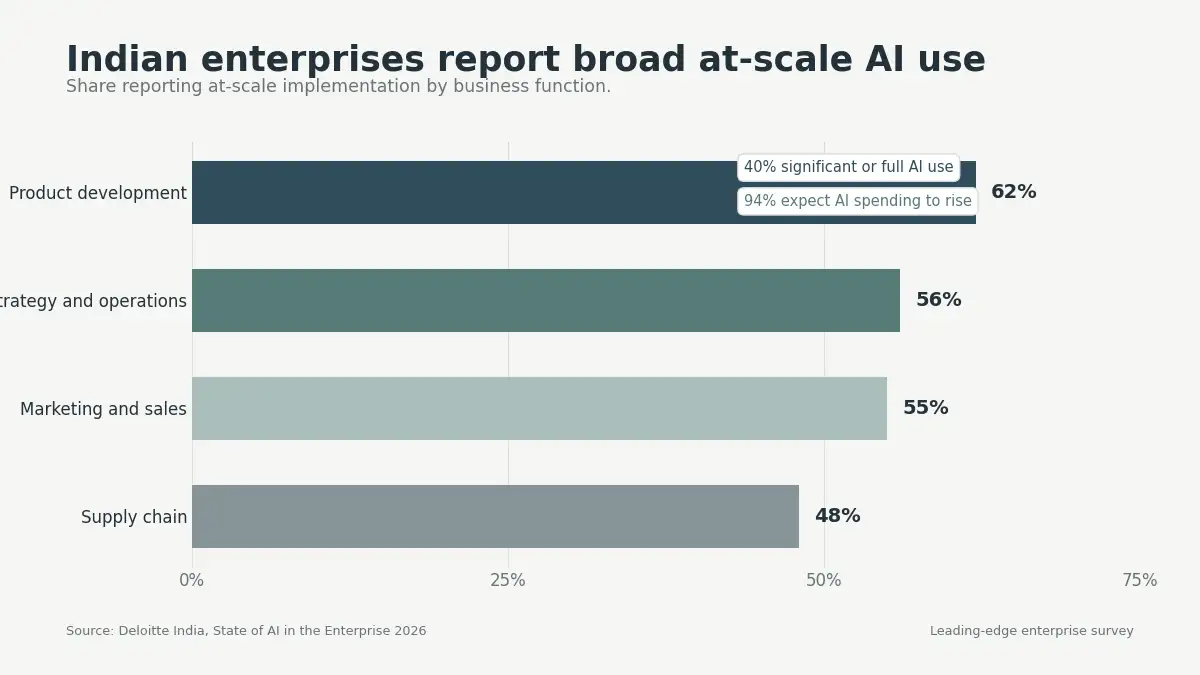
Indian enterprises report stronger scaled use than global peers. Deloitte ranked India first among 15 compared countries. Forty percent reported significant or full AI use. The global comparison stood near 28%.
At-scale deployment reached 62% in product development. Strategy and operations reached 56%, while marketing reached 55%. Supply chain deployment reached 48% across respondents. These figures describe surveyed enterprises, not every Indian business.
Deloitte India found 94% expected higher AI spending. Security controls attracted 68% of planned supporting investment. Data management attracted 61%, while infrastructure attracted 54%. Regulation and compliance remained the largest integration challenge.
NASSCOM’s responsible AI survey covered 574 Indian businesses. About 30% reported mature responsible AI practices. Another 45% had started formal implementation steps. Only 47% of higher-maturity firms felt ready for agent risks.
India verdict: adoption speed now exceeds governance depth. Companies should connect scaling budgets with controls and training. This balance may determine whether early usage creates lasting value.
Businesses gain more value from redesigned workflows
AI tools alone rarely create durable business results. Strong outcomes require process owners, baselines, training, and controls. The data supports a staged operating approach. Each stage answers a different management question.
| Stage | Main question | Practical measure |
|---|---|---|
| Reach | Who can access approved AI? | Licensed users and approved tools |
| Adoption | Who uses AI regularly? | Weekly and daily active users |
| Depth | Which workflows changed materially? | Functions, tasks, and process coverage |
| Value | What financial or service outcome improved? | Cost, revenue, speed, quality, satisfaction |
| Risk | What new failures appeared? | Errors, incidents, rework, and data exposure |
| Readiness | Can the organization scale safely? | Skills, governance, data, and infrastructure |
Start with two to four measurable workflows. Record current cost, time, quality, and customer outcomes. Assign one owner for each workflow. Review performance before expanding access further.
Track downstream work, not only prompt speed. AI may save one employee thirty minutes. Two reviewers may then spend forty minutes checking output. Net workflow time gives the more useful measure.
Approved tools also need clear data rules. Restrict sensitive data inputs by default. Monitor unsanctioned applications and shared credentials. Give employees safe options for common tasks.
The best AI answer depends on the denominator
Common AI questions need qualified, scoped answers. A single percentage often hides several valid measures. The following answers preserve those differences. They also avoid combining forecasts with observed outcomes.
What percentage of businesses use AI in 2026?
Official firm estimates sit near 20% across major economies. McKinsey reports 88% across surveyed organizations using one function. Large companies report much higher adoption than small companies. Always state which business population the percentage covers.
How many people use AI worldwide?
Microsoft estimates 17.8% of working-age people use generative AI. OpenAI separately reports more than one billion active users. Those measures use different products, periods, and populations. Neither figure represents every type of artificial intelligence.
Are AI agents widely deployed?
Agent interest is broad, but scaled use remains limited. McKinsey finds 39% experimenting and 23% scaling somewhere. No single function exceeds 10% scaled agent usage. Spending forecasts describe software demand, not operating maturity.
Does AI produce a positive return?
Task-level productivity gains appear common across current users. Enterprise financial results remain much less common. McKinsey reports 39% with any EBIT impact. PwC finds 12% achieved revenue and cost gains together.
Will AI remove more jobs than it creates?
Current evidence does not support one simple answer. WEF forecasts 78 million net jobs across all macrotrends. ILO finds one-quarter of jobs have some technical exposure. Census currently finds AI-related headcount changes remain rare.
Which industries lead official AI adoption?
Information technology and professional services lead official business surveys. Finance also reports high firm and worker usage. Construction, accommodation, transport, and retail generally trail. Industry digitization explains much of this gap.
How large is the AI market in 2026?
No single market total answers that question safely. Models, agents, servers, services, and devices overlap heavily. Use segment-specific Gartner and IDC forecasts instead. Keep venture funding separate from customer spending.
How much electricity does AI require?
All data centers used about 485 TWh during 2025. AI-focused facilities grew much faster than overall facilities. IEA projects total demand near 950 TWh by 2030. AI remains the largest driver within that increase.
AI is common now, but business depth remains scarce
AI reach is no longer the main business question. Scale, value, governance, and skills now matter more. The best evidence shows broad access and uneven depth. It also shows investment moving ahead of proven returns.
Business leaders should measure workflows, not tool availability alone. Writers should preserve every source’s denominator and period. Readers should treat exposure and forecasts as different evidence. Those habits produce clearer decisions and more reliable reporting.
Final verdict: AI adoption has entered the mainstream. Durable business value still belongs to disciplined operators.