Alibaba: Is it time to buy its shares?
Charlie Munger, the American billionaire and well-known investor, has recently doubled his position in Alibaba. Is it time to buy shares in the Chinese tech giant? In this article, we give you an in-depth, objective analysis of Alibaba and tell you how you can buy shares in the company without paying commission.
One of the things that tend to get people’s attention in the stock market world is watching what big investors are doing. It is of great interest to review their tax returns to see which positions they keep open in their portfolios and which they close.
If a major, successful, well-known investor is buying or selling this or that stock, it is likely that he has good information and his analysis is leading him in that direction.
That seems to be happening with Charlie Munger, Warren Buffett’s old partner, who through his firm, The Daily Journal Corporation (DJCO), holds a large long position in Alibaba Group. A few days ago it was reported that Munger had decided to double his position in Alibaba, news that caused many investors to consider opening or increasing their position in the Chinese conglomerate.
The purchase was reportedly made in the first quarter of 2021, ahead of the Chinese government’s heavy regulatory crackdown on tech firms domiciled in the Asian giant.
Alibaba Group’s NYSE-listed ADR (American Depositary Receipt, the certificate used to buy shares in foreign companies) has been falling dramatically from an all-time high of $319.32 in October 2020 to a price of $118.79 at the close of 2021.
This represents a drop of no less than 62.8%, more than half of its value. But will it continue to fall or is it time to buy Alibaba shares, as Mr Munger did?
Alibaba Group: Some basic facts
- Alibaba Group is the world’s largest online retailer and is domiciled in Hangzhou City, China.
- It is in the consumer cyclical sector and has more than 250,000 employees.
- It operates the online sites Taobao and Tmall. Alibaba’s Chinese retail division accounts for about 70% of its revenue, with Taobao generating revenue through advertising and other commercial data services and Tmall earning commission income.
- The rest of its revenue comes from wholesale, international retail and wholesale marketplaces, cloud computing, digital media and entertainment platforms, logistics services and innovation initiatives.
What does the technical analysis of Alibaba’s stock tell us?
To get a broad picture, let’s use the monthly candlestick and volume chart of Alibaba Group’s NYSE-listed shares.
Many believe that the current price of its ADR is a real opportunity, a consequence of the negative effects of the new regulatory policy. It is argued that once this juncture has passed the price will resume its upward trajectory, but is it really that simple? Let’s see:
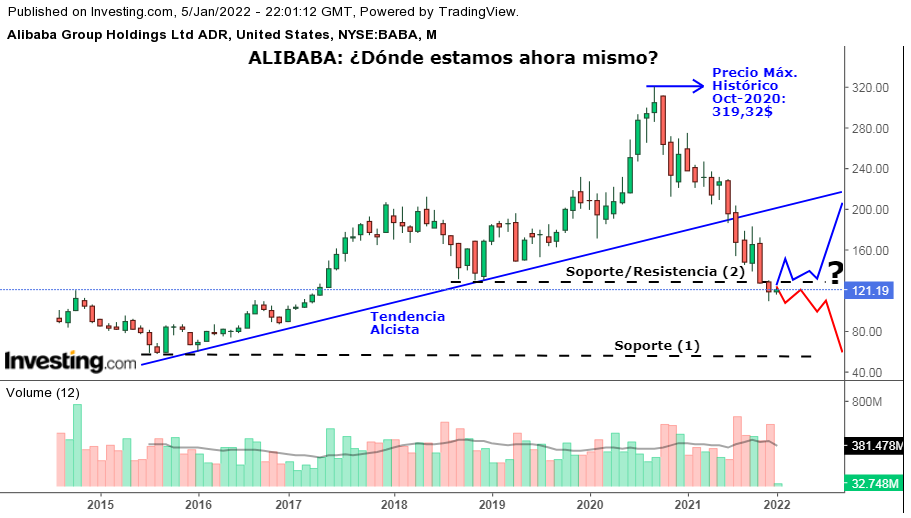
The monthly chart is not usually used to define specific entry points, instead of lower timeframes, such as daily, are used. However, it gives us a long-term perspective of Alibaba Group’s ADR price since its IPO on the NYSE in September 2014.
We can observe the development of a clear long-term uptrend between the end of 2015 and 2020. The ADR reaches its all-time high of $319.32 in October 2020, but the Chinese government’s aggressive regulatory campaign impacted the share price very negatively in the following months.
This trend line was broken in August 2021 when the ADR closed at a price of 166.99$. At the very least we can say that the long term trend has stopped and we are now in an intermediate downtrend. In the session of 05 January, the share was trading at 121.19$.
As for volume, we can see that it is increasing above its 12 month average at the relevant highs and lows of the trend.
Volume is a secondary confirmation element and should be watched with great interest at critical points. Any relevant move should be accompanied by volume strength equal to or above average.
What can be expected on a technical level at this point in time?
Before attempting to answer this question we must remember that the market can do anything at any time and that no one can control it. It all depends on the psychology of market participants, which fluctuates between cycles of greed and fear.
This being the case it is interesting to note two relevant areas of the price that are worth keeping in mind. One support is around $57-58 and was last tested between August and October 2015, precisely when the long-term uptrend started. The other support/resistance is around $129-130 and was last tested between October 2018 and January 2019.
In light of technical analysis:
- Price discounts all relevant information, so it is likely that Alibaba Group ADR has already assimilated the new hostile regulatory policy. However, one has to assume that the rules of the game have changed and Chinese tech companies are now at the mercy of the political bureaucracy. In other words, the company no longer operates in an environment of free competition and no longer sets its own objectives, and this is no small thing.
- The market has a memory, so its participants are likely to behave in a similar way as in the past if circumstances are similar. This is why we cannot ignore the supports and resistances closest to the current price. These are areas to be watched carefully during 2022.
- Prices tend to move in trends, so we need to have some clear signals that allow us to anticipate with some probability what might happen. The price could continue its intermediate downtrend, it could remain in a sideways range, or it could head back to its former long term upward trajectory.
We can outline three possible scenarios for the medium/long term:
BEARISH SCENARIO
In the first scenario, the price maintains its intermediate bearish trajectory. In this case, the current resistance around $129-130 will probably be tested and, in case it is breached, the price could continue to fall to the next support around $57-58.
So although the current price is relatively low, we cannot assume that it cannot fall further. It is true that the ideal time to buy is in times of panic when everyone is selling at very sharp lows, the question is whether we have already reached those lows and a cycle of greed is in the offing.
Signals to consider in the first scenario are unsuccessful attempts to break through the nearest resistance. If this does not happen, the price could fall further.
SIDEWAYS RANGE SCENARIO
In the second scenario, the price would remain in a sideways range around the $129-130 support/resistance. We are currently at $121.19, but the price could stay at these levels for some more time until it clarifies its trajectory. This is more of an intermediate scenario.
BULLISH SCENARIO
In the third scenario, Charlie Munger’s scenario, the price breaks through the $129-130 support/resistance, consolidates and continues to climb towards its long term upward trajectory. It is important to consider that in order to retake the trend line the price would have to reach at least $218.
Of course, a risk investor does not want to wait until that price to enter, but should at least have elements pointing in that direction. In this case, at least the price needs to break through resistance strongly and consolidate above it to assume that we are exiting bearish territory.
Alibaba Group: Intrinsic Value vs Market Price
The intrinsic value of a financial asset is that which is derived from the fundamentals of the business as opposed to its market value, which is conditioned by market psychology and may or may not coincide with the intrinsic value.
Such psychology may skew the value of an asset beyond its intrinsic value, but over the medium to long term, market forces are expected to act rationally and this will lead market value to converge with intrinsic value.
The best long-term investment opportunities come from buying companies whose shares are below their intrinsic value. In such cases, the market value would tend to rise over time.
There are various methods to measure the intrinsic value of an asset, including discounted cash flow and relative valuation among stocks of similar companies. For many analysts, this is the case with Alibaba Group and the stock is considered to be undervalued by the market. For example, Chelsey Tam, Senior Equity Analyst at Morningstar considered in an analysis published on 20 December 2021 that BABA’s estimated fair value was $188, while the stock is trading at around $121.19 as we saw in the chart earlier this year.
One of the most popular is the Price to Earnings Ratio:
PER Ratio = Price per Share / Earnings per Share.
This indicator tells us how much money investors are willing to pay for each monetary unit of earnings. It is used in fundamental analysis to help determine whether a stock is undervalued or overvalued.
It can also be interpreted as the number of years required to recoup the investment in a share purchase while maintaining constant earnings.
A high P/E Ratio (above 25) may indicate that the company is overvalued and its share price has risen sharply, but it may also indicate that investors think that profits will continue to rise and therefore higher share prices are worth paying.
A low P/E Ratio (below 15) may indicate that the company is undervalued and its share price has fallen sharply, but it may also imply that investors believe that earnings will fall in the coming years and it is not worth paying higher prices.
It is very important to compare the P/E Ratio with other companies in the same sector, as it can vary according to the type of activity.
A simple approximation of intrinsic value can be made using the P/E Ratio:
Intrinsic Value = Historical P/E Ratio x Expected Earnings per Share.
Let’s see:
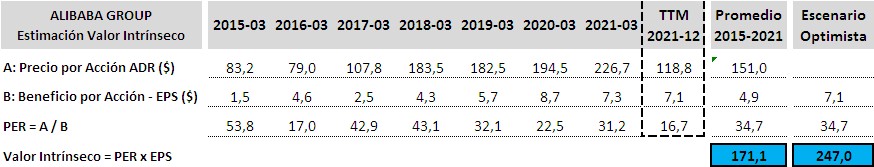
A series of data has been compiled for the company’s annual close (in March) between 2015 and 2021, in addition, the last 12 months are reflected in the “TTM” (Trailing Twelve Months) column. For each year the P/E Ratio has been calculated according to the indicated formula.
We can see how BABA’s ADR has been trading at high P/E ratios in recent years. This is not surprising, as it is a company considered to be a “growth” company. That is a company that does not pay dividends yet, as it reinvests all its profits to increase the scale of the business.
However, if we look at the last 12 months we see a P/E Ratio of only 16.7; which is low. This may mean that investors are discounting the effect of hostile regulation and are no longer willing to pay such high share prices.
In fact, it could mean that BABA’s own intrinsic value was reduced, as future profits could be compromised by the new regulatory framework.
If we look at the average values 2015-2021, the price per share is $151, so BABA is already trading below the average of the last 7 years.
The earnings per share are $4.9 and the P/E ratio is 34.7, which reflects the valuation before the regulatory adjustment. If we estimate the intrinsic value today we would get a value of $171.1 per share.
If we project the intrinsic value with the historical P/E ratio of 34.7 and earnings per share of $7.1 as in the last 12 months, we would get a value of $247 per share.
So there is room for growth in BABA’s ADR, but at the cost of much higher risk, so the current situation needs to be taken with caution. It is likely that the intrinsic value resulting from the fundamentals of the business has been reduced.
Conclusions
After the end of Mao Zedong’s so-called Cultural Revolution and the leader’s own death, China took the path of economic pragmatism and reform towards the end of the 1970s.
This risky political movement was led among others by Deng Xiaoping. From this came statements such as “to be rich is great” or “it doesn’t matter what colour the cat is as long as it catches mice”. The new incentive was to earn as much money as possible to help achieve the country’s economic development goals.
China is now an economic power that rivals the US for global hegemony in the coming decades.
However, the move towards economic openness seems to have ended under the country’s new leader for life, Xi Jinping. It appears that the economy will now be subordinated to Beijing’s ideological, geopolitical and even military objectives.
The growing tensions with Washington and their potential regulatory impact should not be discounted. This is a major consideration.
If the discretion of political officials increases and becomes more intrusive over technology companies, the market could discount even more value, not only market value, but also intrinsic value. This could keep us in the scenario of very low P/E Ratios like the current one of only 16.7.
Furthermore, the year 2022 looks rather a complex judging by the prospect of rising interest rates in the US to manage the inflationary environment. On the other hand, there are mid-term elections and these tend to mark lows in the stock market.
In China, other major challenges to the health of its economy, such as the solvency crisis of the real estate giant Evergrande, should not be overlooked.
A feature of modern financial and capital markets is their systemic correlation. What happens in one circuit eventually affects the rest of the system.
It is worth remembering some of the golden rules laid out by Stan Weinstein in his book “Secrets for Profiting in Bull and Bear Markets”:
“Never buy a stock without checking its chart. We have already done so and invite you to review the weekly and daily charts for an even broader perspective.
“Never buy a stock because it has gone down and you think it is cheap. We have already advised you not to rule out the scenario of a more prolonged price decline.
“Don’t buy a stock that is in a downtrend on the chart. You have already seen for yourself that we are in an intermediate downtrend, we need signals that warn us of its possible continuation or termination.
The technical analysis seeks to anticipate the most likely scenarios in order to take advantage of one or the other. But when the fundamentals change, so do the probabilities.
How to buy Alibaba shares without paying commissions?
If after reading our extensive analysis of Alibaba you decide to buy shares in the tech giant, the favourite option recommended by El País Financiero is the broker eToro.com, an investment platform used by more than 20 million users, based in London and authorised by CySEC and the FCA (the UK regulator).
When it comes to buying Alibaba shares, eToro offers us a great advantage: No commissions of any kind (0%) on the purchase, sale or custody of shares. Another important point in eToro’s favour is that you can add funds to your account immediately by credit card, Paypal or bank transfer (among others).
In addition, eToro.com allows you to invest in Alibaba by buying fractions of shares so that even investors with little capital can invest in large companies whose shares have a high price.