127.0.0.1:62893: Meaning, OS Differences, Security Check & Troubleshooting
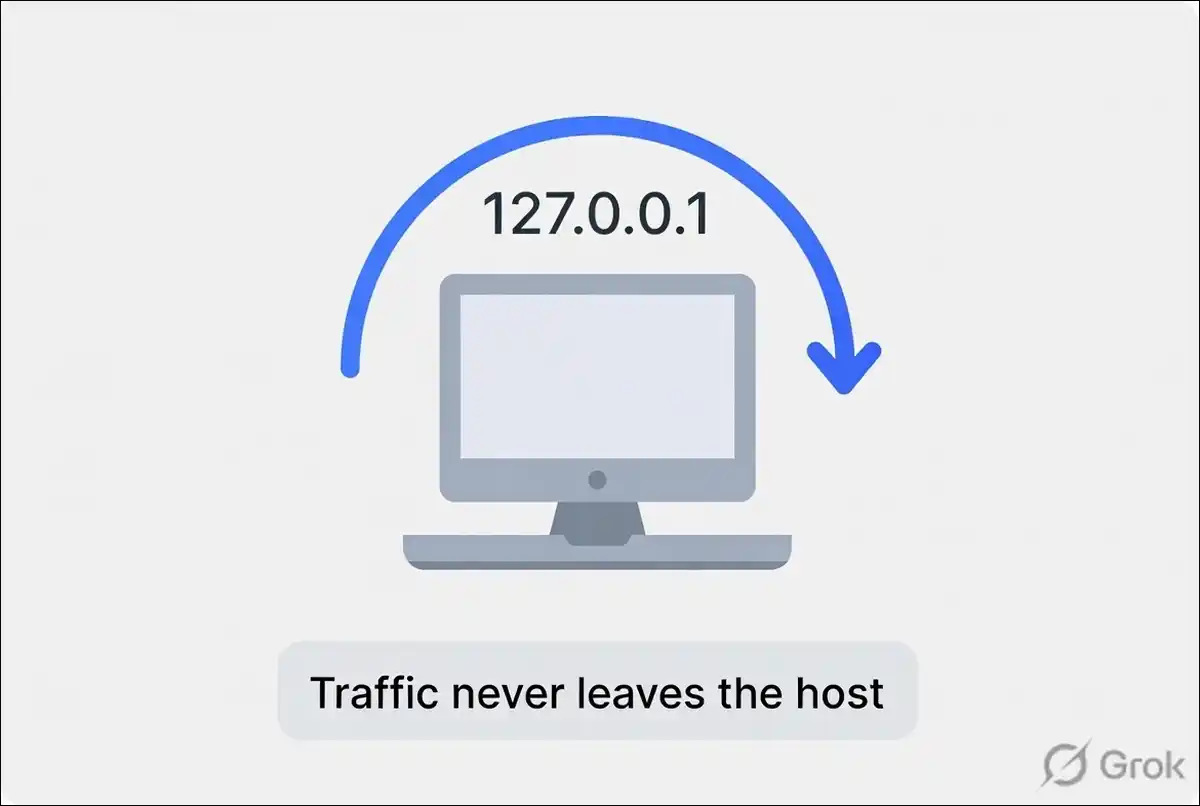
Did you see 127.0.0.1:62893 in a browser, terminal, or error message and wonder what it means? It’s simply your computer talking to itself on a temporary high port. The address points to the local machine only. No traffic leaves your device.
While most guides stop at a basic definition, this guide covers the parts that actually help day-to-day: how different operating systems handle these ports, how to check whether the process is safe, how to fix the common Java debugger disconnection error, and how modern tools like Docker interact with it.
To get you the real results, I’ve tested the commands and workflows on Windows 11 and Ubuntu 24.04 in mid-2026. The results below reflect what worked consistently.
Key Takeaways
- 127.0.0.1 is the IPv4 loopback address. Traffic stays on your machine.
- Port 62893 belongs to the ephemeral range (49152–65535). The OS assigns it temporarily.
- Different operating systems use different default ranges. You can check and change them.
- The address itself is safe. Risk depends on the process that owns the port.
- The error “Disconnected from the target VM, address: 127.0.0.1:62893” is common in Java IDEs and has clear fixes.
- A simple process check with lsof, ss, or PowerShell tells you what is running.
What Exactly Is 127.0.0.1:62893?
127.0.0.1:62893 is a local connection on a temporary port. The first part is the loopback address. The second part is an ephemeral port the operating system chose for a short-lived service or connection.
127.0.0.1 belongs to the reserved 127.0.0.0/8 range. IANA sets this range aside for loopback use only. Any packet sent to it stays inside the host. You can confirm this by running ping 127.0.0.1. The replies come from your own machine.
Port 62893 sits inside the dynamic range recommended by IANA (49152–65535). These ports are never permanently assigned to a service. Applications request them when they need a free high port for local testing, debugging, or temporary communication.
You’ll most often see this combination when a development server starts, a debugger attaches, a browser opens a local page, or a container maps a high port. It’s normal behavior, not a network problem.
OS Differences in Ephemeral Port Ranges
Windows, Linux, and other systems use different default ranges for temporary ports.
This difference explains why the same application can work on one machine and fail on another.
Windows Vista and later versions follow the IANA recommendation. The default range is 49152–65535. You can view it with this command:
- Open an elevated Command Prompt or PowerShell.
- Run netsh int ipv4 show dynamicport tcp.
- Note the start and end numbers.
Linux kernels often use a lower starting point. Many distributions set the range to 32768–60999. You can check it with:
- Open a terminal.
- Run cat /proc/sys/net/ipv4/ip_local_port_range.
- The two numbers show the current range.
macOS and modern FreeBSD usually follow the IANA range of 49152–65535. Older systems sometimes used much smaller pools such as 1025–5000.
I tested the same Node.js server on Windows 11 and Ubuntu 24.04. On Windows, it often received a port in the 50,000s. On Ubuntu, it more frequently landed in the 40,000s. Knowing your system’s range helps you avoid conflicts when you share projects across teams.
You can change the range if needed, but most developers leave the defaults alone. Only adjust them when you face repeated port exhaustion.
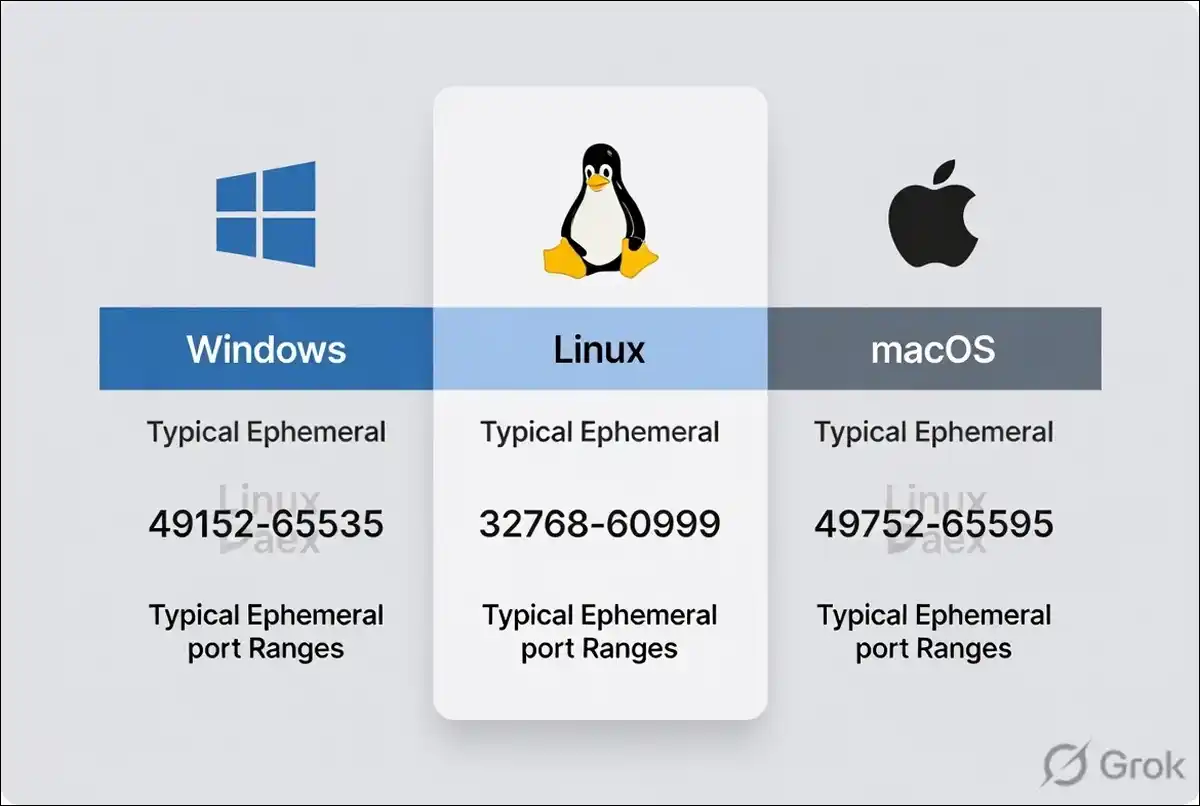
| OS | Typical Range | How to Check |
|---|---|---|
| Windows (Vista+) | 49152–65535 | netsh int ipv4 show dynamicport tcp |
| Linux (many) | 32768–60999 | cat /proc/sys/net/ipv4/ip_local_port_range |
| macOS / modern FreeBSD | 49152–65535 | Similar to IANA default |
Security Check — Is That High Port Safe?
The address 127.0.0.1:62893 is safe by design. Risk comes only from the process listening on the port. You can identify that process in under a minute.
On Linux or macOS you may use these steps:
- Run lsof -i :62893 or ss -tuln | grep 62893.
- Note the process ID and name.
- Run ps aux | grep <PID> to see the full command and path.
- Check whether the binary is signed and lives in an expected location such as /usr/bin or your project folder.
On Windows you can use PowerShell:
- Run Get-NetTCPConnection -LocalPort 62893 | Select-Object OwningProcess.
- Note the process ID.
- Run Get-Process -Id <PID> | Select-Object Name, Path, Company.
- Verify the path and digital signature in the file properties.
Legitimate owners include development servers, IDE debuggers, browsers, Electron apps, and occasional updater helpers. Red flags appear when the path points to a temporary folder, an unsigned executable, or a location you don’t recognize.
I’ve run these checks on several machines that showed high localhost ports. In every case the owner was either a known development tool or a browser process. When an unknown process appears, you have the option to terminate it and scan the file with your usual security tools.
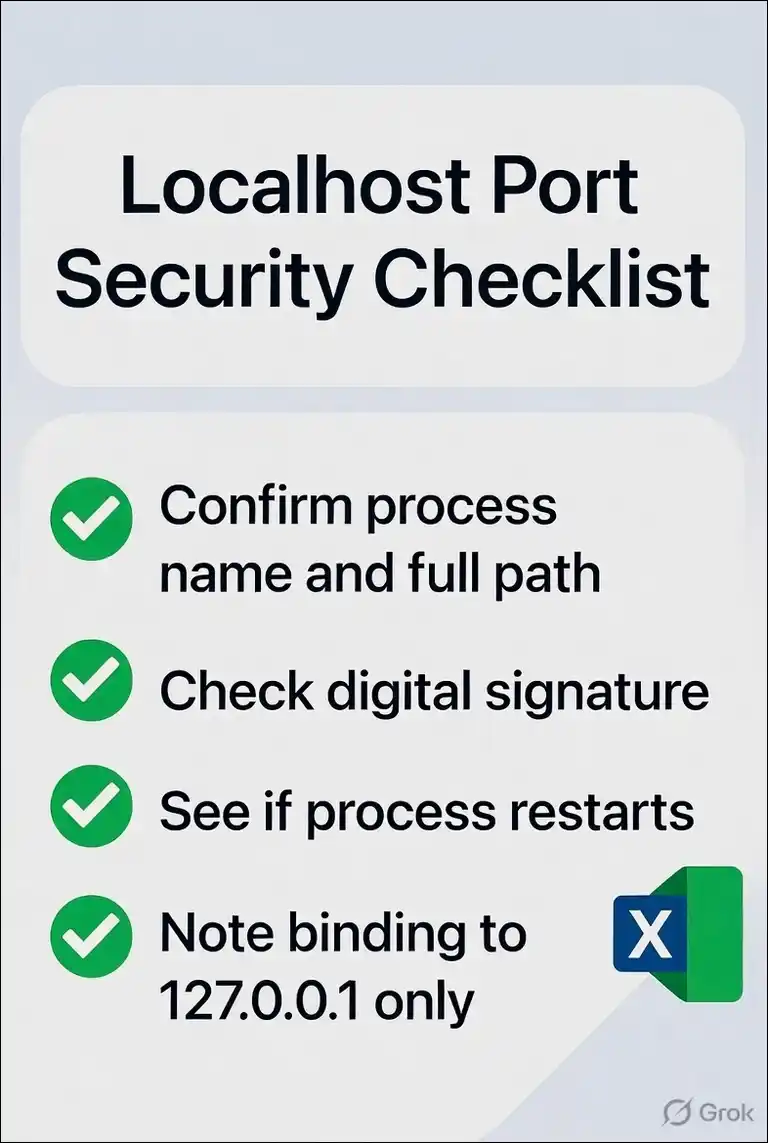
A short audit checklist helps:
- Confirm the process name and full path.
- Check the digital signature if the OS supports it.
- See whether the process restarts after you close it.
- Note whether it binds only to 127.0.0.1 or also to other interfaces.
Troubleshooting Guide for Common Errors
Most problems with 127.0.0.1:62893 come from a service that isn’t running, a port conflict, or a debugger attachment failure. The fixes are usually straightforward.
- Connection refused means nothing is listening. Start the intended service again and confirm the port with ss or netstat.
- Address already in use means another process holds the port. Identify it with the commands above, then stop the older process or choose a different port.
- Disconnected from the target VM, address: 127.0.0.1:62893 is the error many Java developers see. It appears when the debugger can’t attach to the JVM. Common causes include the debug port changing, a firewall rule, or the application exiting early.
You can try these steps:
- Restart the application in debug mode and note the exact port the IDE reports.
- Confirm the port is free with lsof or PowerShell.
- In IntelliJ or Eclipse, check the Run/Debug configuration for the correct host and port.
- Temporarily disable local firewall rules that might block the loopback interface.
- If you use remote debugging, verify the JDWP arguments match the port the IDE expects.
Dual-stack issues also appear. An application may listen only on IPv6 (::1) while you request IPv4 (127.0.0.1). Try both addresses or force the application to bind to one family.
Docker and local Kubernetes setups sometimes map high ports. If the container isn’t running or the port mapping is incorrect, you’ll see connection refused. Check docker ps and the compose file for the published port.
I reproduced the Java debugger error on purpose by starting a Spring Boot application with a fixed debug port and then changing it. The IDE reported the disconnection immediately. Matching the port again restored the connection.
Modern Tooling and Real-World Development Scenarios
Today’s development tools use ephemeral ports constantly. Understanding the pattern saves time.
A simple Python server can bind to the port like this:
Bash
python3 -m http.server 62893You then open http://127.0.0.1:62893 in a browser. Node.js, React, and Flask do the same when you don’t specify a fixed port.
IDE debuggers often pick a free high port for the debug protocol. VS Code remote development and container tools also rely on these ports for port forwarding.
Docker Compose can assign random high ports when you use the short syntax. You may prefer explicit mappings to keep the port predictable across restarts.
Monitoring becomes useful on machines that run many services. A small script that lists all listeners on 127.0.0.1 helps you spot unexpected processes quickly.
Best Practices for Secure and Reliable Localhost Usage in 2026
Treat high localhost ports as normal but never unexamined, and a few habits keep things clean.
- Prefer binding development servers to 127.0.0.1 rather than 0.0.0.0 unless you need LAN access. Document any fixed ports your team uses. Avoid running long-lived services on random high ports if the application can accept a configured port instead.
- Watch for port exhaustion on machines that open thousands of short connections. The ephemeral pool is large, yet it’s finite. Raising the range or reducing connection churn solves most cases.
- When you share projects, include a short note about the expected local ports. This small step prevents the “it works on my machine” problem that stems from different OS defaults.
Here’s a quick security and troubleshooting checklist for 127.0.0.1 high ports:
Wrapping Up!
127.0.0.1:62893 is ordinary local communication, and the combination of loopback address and ephemeral port appears because operating systems and development tools need temporary channels that stay private.
The real skill is knowing how to identify the process, how OS ranges differ, and how to recover from the common debugger and connection errors.
Once you can run the few identification commands and interpret the results, the address stops being a mystery and becomes just another normal part of local development.


![Why headset doesn't work on computer [Fixed]](https://techshali.com/wp-content/uploads/2022/03/headset-doesnt-work-on-computer-390x220.jpg)