whoburnedmore: Track Your Real AI Coding Token Burn & Costs (Complete 2026 Guide)
If you’re using AI coding agents, you can now see exactly how many tokens you’re burning and what it’s costing you. whoburnedmore makes that possible now.
This tool reads the local log files from tools like Claude Code and feeds into an optional public leaderboard where developers compare their daily and weekly totals.
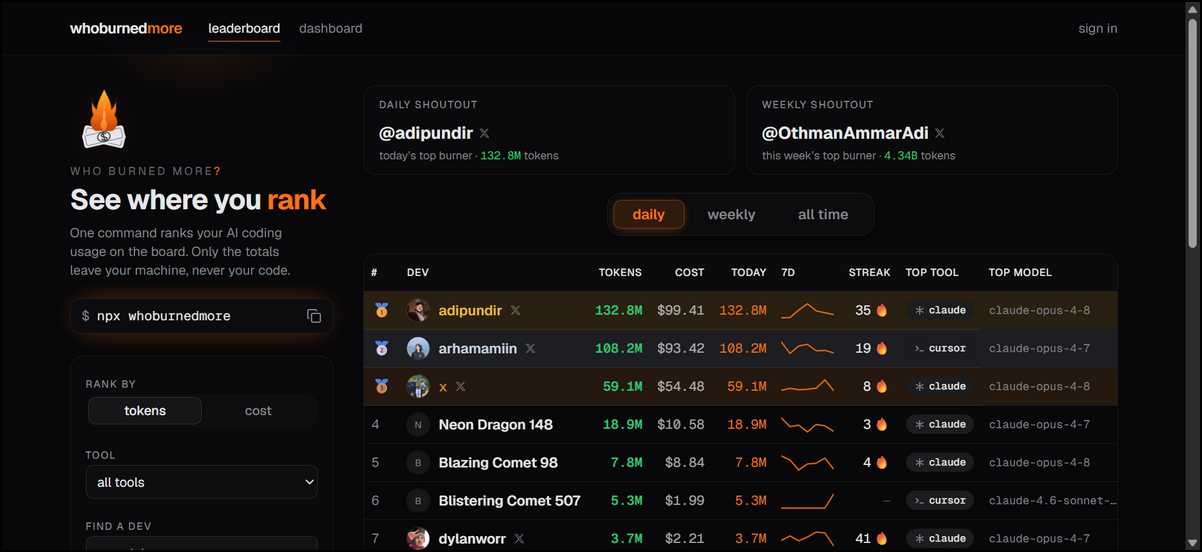
As of mid-June 2026, the public numbers show more than 154 billion tokens burned in total, with estimated costs around 123,000 dollars. One weekly leader sits at 4.34 billion tokens with an estimated cost near 4,700 dollars.
These figures come from real developer activity and keep growing every day.
What whoburnedmore actually does
Basically, whoburnedmore is an open-source command-line tool that reads the transcript files your AI coding agents already write on your machine. It calculates total tokens used, breaks the numbers down by model and project, and shows estimated costs based on current pricing.
You have the option to share only your daily totals on the public leaderboard if you’d like. The open-source version stays completely local and never sends data anywhere. That’s the key point here.
Only aggregate daily token counts ever leave your computer. Your actual code and prompts stay private.
The hosted version at whoburnedmore.com adds the leaderboard and group features. You can still run everything locally with the –local flag whenever you prefer full privacy. This design gives you real choice. You get clear numbers either way.
How the whoburnedmore works under the hood?
You might be wondering how it pulls all that together. whoburnedmore reads the JSON Lines transcript files that AI coding agents create during your sessions. These files sit in a hidden folder on your computer, usually inside ~/.claude/projects/.
The tool looks for usage blocks that record input tokens, output tokens, cache reads, and model names. It adds everything up by day, by model, and by project folder. Then it applies a pricing table to show dollar estimates. You can edit that pricing table yourself if your actual rates differ.
Here’s the nice part: the local version performs zero network requests and works offline after the initial download.
The open-source edition stays 100 percent local. Nothing leaves your machine unless you choose to share daily totals.
Quick start guide
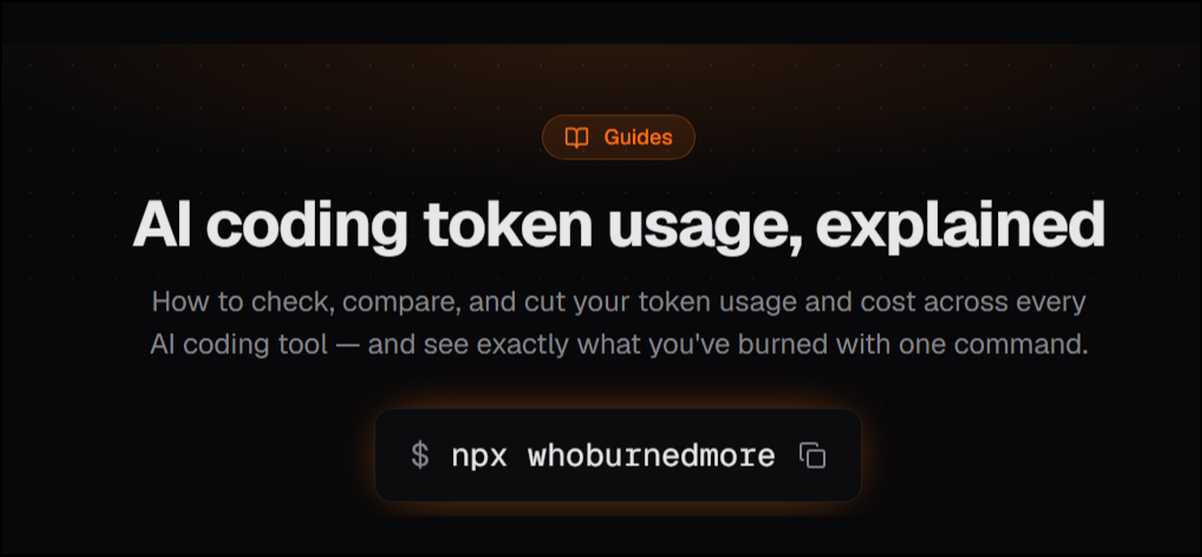
Most developers already have Node.js version 20 or newer. You can open your terminal and run this command:
text
npx whoburnedmoreThe tool scans your default transcripts and prints a report right away. Here are the options you’ll probably use most:
- npx whoburnedmore –html creates a self-contained HTML dashboard you can open in any browser.
- npx whoburnedmore –since 30 limits the report to the last 30 days.
- npx whoburnedmore –local keeps everything on your machine and skips the leaderboard.
- npx whoburnedmore –json outputs raw data for scripts.
You can run the HTML version first if you’d like visual reports. The file opens directly and works without an internet connection.
Troubleshooting common first runs
Sometimes people see zero tokens on the first try. That’s usually because the tool can’t find the transcript folder yet. You may want to confirm that you’ve actually used Claude Code or a supported agent on this machine.
You can point the tool at a different folder with the –dir flag if needed. Permission issues show up sometimes too. Just make sure your terminal user can read the hidden .claude directory.
The project GitHub page lists the exact supported paths. Most issues clear up once you confirm the logs exist and run the command again.
Understanding your burn report
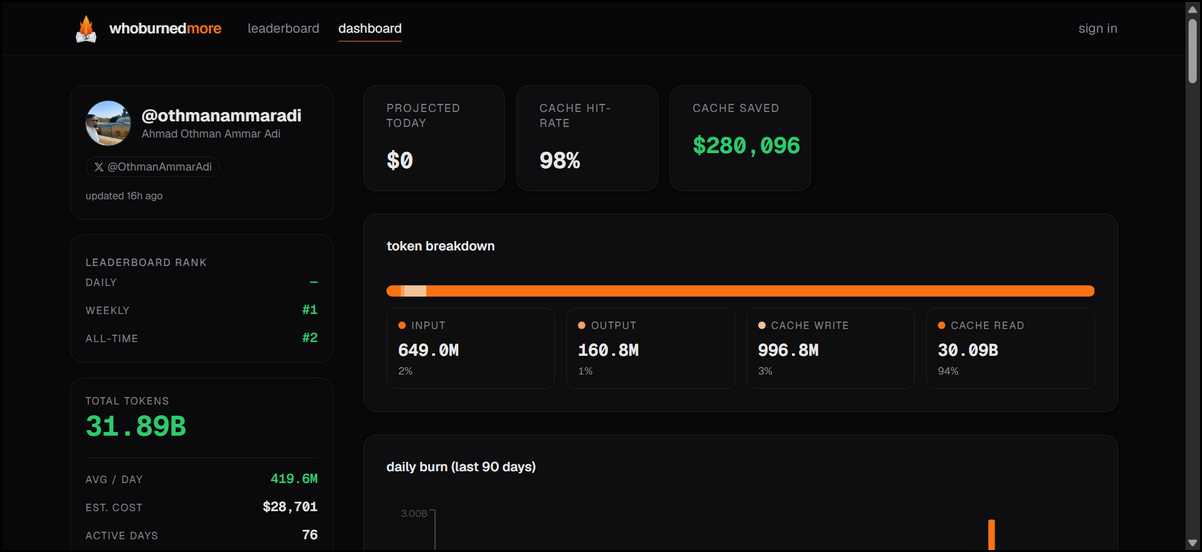
A typical report starts with the big numbers. You see total tokens, estimated cost, number of assistant messages, and active days.
Here’s a real example from the project documentation:
1.82 billion tokens burned. Estimated cost: 3,410 dollars. 12,704 assistant messages across 18 active days from late May to mid-June 2026.
The report then splits the data by model and project. It also shows the prompt cache read-hit rate. That 97.4 percent hit rate in the example above is why costs stayed lower than the raw token volume might suggest.
High cache rates mean the agent reused previous context instead of re-reading everything. Savings add up quickly on longer sessions.
What the numbers really mean for your workflow
Token counts reflect how much context the agent processes. Large codebases, long chat histories, and repeated file reads drive the totals higher. Output tokens cost roughly five times more than input tokens on current pricing, so verbose responses add up fast.
Project breakdowns reveal where you focus your AI work. One developer might burn most tokens inside an API folder while another spends heavily on frontend tasks. These patterns help you see where AI assistance actually delivers the most value.
Bold practical note: A 97 percent cache hit rate can cut effective input costs by more than 80 percent on repeated reads. Results still depend on how much your prompts overlap between sessions.
Current token pricing in 2026
Costs depend on the model and whether you stay within subscription limits or move to pay-per-token API access.
Here’s a clear comparison based on publicly discussed Anthropic rates:
| Model | Input per million tokens | Output per million tokens | Notes |
|---|---|---|---|
| Haiku 4.5 | ~1 dollar | ~5 dollars | Fastest option for simple tasks |
| Sonnet 4.6 | ~3 dollars | ~15 dollars | Good balance for most coding work |
| Opus 4.x | ~5 dollars | ~25 dollars | Highest capability and highest cost |
Cache reads usually cost about 10 percent of normal input price. Subscription plans start at 20 dollars per month for Pro access with rate limits. Higher tiers increase those limits. Heavy users often move to direct API billing once they exceed the windows.
Suggested visual placement: In the pricing section. Alt text: Clean comparison table of 2026 Claude model token pricing for input, output, and cache reads.
How Meta’s internal experiment compares
That’s the current pricing picture. To put it in context, some big companies experimented with internal token rankings earlier this year.
In April 2026 Meta ran an internal leaderboard called Claudeonomics that tracked token use across more than 85,000 employees. Reports state the group burned 60 trillion tokens in a single 30-day period, with the top individual user averaging 281 billion tokens.
Some estimates placed potential costs for the highest users in the hundreds of thousands of dollars depending on model mix. The experiment later ended after internal concerns about wasteful usage patterns. Amazon reportedly shut down a similar internal ranking tool for comparable reasons.
The public whoburnedmore leaderboard works differently. Participation stays voluntary. Only daily totals appear. You have the option to switch to private mode instantly. Internal company leaderboards can drive adoption, yet they can also create incentives that don’t always align with productive work. The public version leaves the choice with each developer.
The public leaderboard right now
The site shows daily and weekly leaders along with community totals. The current top weekly user sits near 4.34 billion tokens. Several others exceed 3 billion. Streaks appear as fire emojis next to active names.
You can create private group leaderboards for friends or teammates if that sounds useful. Share one command and everyone joins without accounts. The design keeps the focus on friendly comparison rather than pressure. Many developers treat it like a personal tracker for their AI workflow.
Suggested visual placement: Before the leaderboard deep dive paragraph. Alt text: Close-up of whoburnedmore leaderboard entries showing usernames, token counts, estimated costs, and streak counts for top developers.
How to lower your token burn without losing productivity
You can reduce totals while still getting the benefits of AI assistance. Most gains come from small workflow adjustments.
- You can break large refactoring tasks into smaller, focused sessions. This improves cache reuse.
- Keep project folders organized so agents read fewer unrelated files.
- You may want to use cheaper models for routine work and reserve stronger models for complex decisions.
- Review long agent responses before accepting them and trim unnecessary explanations in follow-up prompts.
- Clear or summarize chat history when moving between unrelated features.
- You can edit the pricing table inside the tool so estimates match your actual rates.
Realistic expectation: Some developers cut effective costs by 40 to 60 percent after applying these steps for two weeks. Results vary by project size and coding style. High cache rates help most on repetitive maintenance work. Brand new projects naturally show lower hit rates until patterns emerge.
Test changes one at a time. Run a report before and after each adjustment so you see the actual difference.
Edge cases and limitations
Of course, no tool is perfect. Here are some edge cases worth knowing about. Multi-machine workflows require manual effort right now. You can copy transcript folders or run the tool on each machine separately and combine totals yourself. Custom agents may need updates to the transcript parser. The project welcomes contributions for new formats.
Cost estimates remain approximations based on public pricing. They don’t include private discounts or enterprise agreements. The leaderboard reflects only people who choose to share data. It doesn’t represent all AI coding usage across the industry.
Bold honest caveat: The tool shows what happened. It doesn’t judge whether the usage was efficient. You still decide what the numbers mean for your work.
Comparison with similar tools
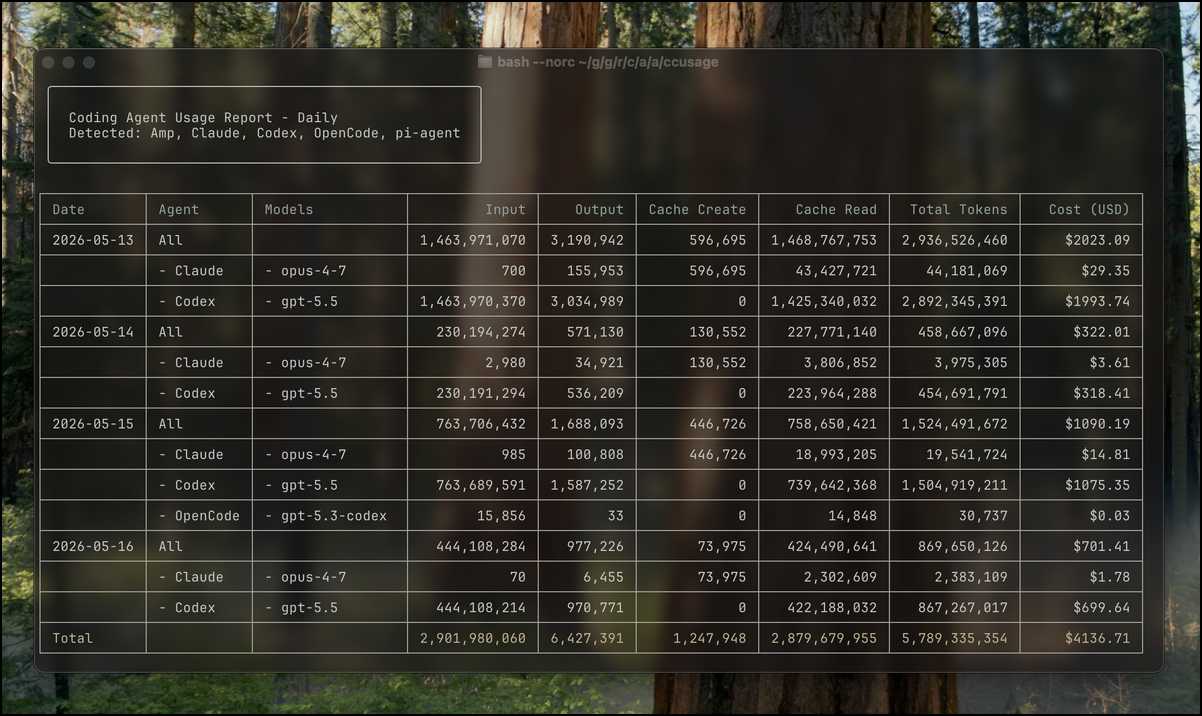
ccusage offers another local CLI focused on Claude Code logs. It provides strong burn-rate monitoring and statusline integration while staying fully local by default.
whoburnedmore adds the optional public leaderboard, group features, HTML export, and broader multi-tool support in the hosted version.
Both tools can run side by side if you want different views. Native dashboard features inside some IDEs give partial visibility but rarely combine multiple agents or show clear dollar estimates. Choose based on your main need.
Pure local analysis works well with either tool. Public comparison favors whoburnedmore.
Should you run whoburnedmore?
Most developers who try it report the numbers feel useful within the first week. You learn where time and money actually go. The public leaderboard adds a light competitive element for some people. Others prefer the private local mode and never share.
The tool removes guesswork about costs. It doesn’t automatically improve your code or guarantee lower bills. You still control how you use the information. Teams can run private group leaderboards to discuss patterns together.
Freelancers often use the data when quoting projects that involve heavy AI assistance.
You can start with the local HTML report. Decide later whether the leaderboard adds value for you.
People Also Ask
No. The local version never connects to the internet after download. The hosted version uploads only daily token totals.
They use current public pricing tables. You can edit the table inside the tool if your rates differ. The numbers stay close to reality for standard API billing.
The local scanner focuses on Claude Code transcripts. The public leaderboard accepts data from several other CLI agents through the hosted path.
Run everything with the –local flag. Nothing leaves your machine. You have the option to delete entries from the leaderboard at any time if you change your mind.
Once a week works for most people. Daily checks make sense during heavy project phases when you want to spot trends quickly.
Not necessarily. Complex debugging or large refactors legitimately consume more tokens. The report helps you distinguish necessary volume from avoidable repetition.
Yes. Create a private group leaderboard. Share the join command with teammates. Everyone sees combined or individual views depending on settings.
Your cost estimates update immediately. This helps match real enterprise rates or promotional pricing.
The GitHub repository shows recent commits. The project accepts contributions for new agent formats and dashboard improvements.
Final thoughts on tracking your AI usage
Clear numbers help you make better decisions about which tasks deserve AI assistance and which models fit each job. whoburnedmore gives you those numbers without forcing you to share anything. The public leaderboard remains optional and easy to exit.
Many developers discover they already work efficiently once they see the breakdown. Others find small changes that free up budget for more ambitious experiments. You can run the command today and look at your own report. Then decide what the data tells you about your current workflow.
The tool stays simple on purpose. Its value comes from turning invisible usage into visible facts you can actually act on.